
A strong February result, but used car prices are heading upwards again
- Used vehicle prices went up in February, after a long period of monthly reductions
- Monthly retail and wholesale used vehicle sales were at their highest since 2020
- At the same time inventory across retailers declined for the third straight month
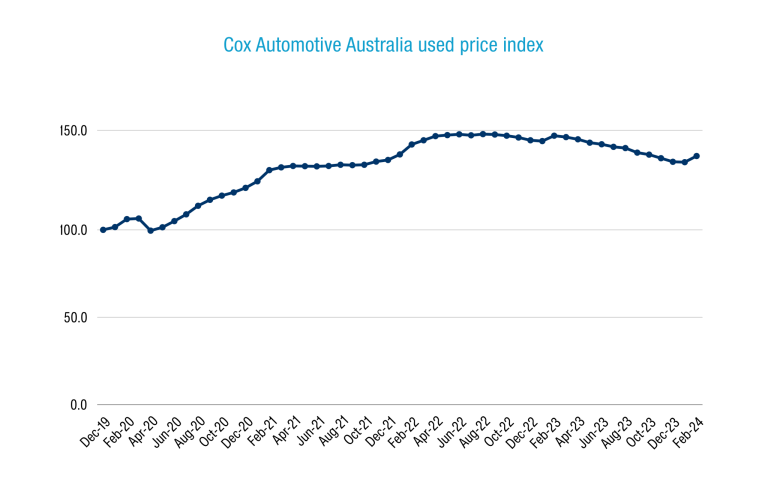
The average price of used vehicles in Australia’s retail dealers crept upwards in February 2024, ending a 12-month sequence of price reductions.
The Cox Automotive Australia Used Price Index ended February on 137.1, up 2.3% for the month. This denotes an average 37.5% price increase across the used vehicle market since December 2019, when the Index began.
The Index peaked at 148.1 in August 2022, meaning prices are still on average some 7.4% lower than when prices were running at their hottest amid new vehicle shortages.
Dealer used vehicle sales
Sales of used vehicles in February were up 2.9% over January and 9.3% higher than February 2023. The sales result was also the highest monthly tally since November 2020.
Of all these sales 47.2% were SUVs, 32.7% passenger cars (sedans, hatchbacks, wagons, coupes), and 19.8% were light commercial utes and vans.
The top-selling models were the Ford Ranger (up 12.1%), Toyota HiLux (+10.5%), Toyota Corolla (+3.7%), Toyota RAV4 (+7.7%) and Hyundai i30 (+0.3%).
Traditional low-riding passenger vehicles were the easiest to sell for dealers with an average selling time of 37 days. SUVs took 40 days on average to sell, and utes took 42 days.
While EVs are growing quickly on the new side of the market, this only really got underway in earnest in 2022, meaning there aren’t a great deal in the used market yet: Just 0.3% of the total sold volume for the month.
Dealer used vehicle supply
While retail dealer used vehicle sales were at a more-than-three-year high, inventory shrank for the third straight month, falling a further 2.0% for the month.
It’s important to note however that inventory as of the end of February sat 32.4% higher than at the same time in 2023. Market Days’ Supply has fallen to 62 days, down from 65 in January and 68 in December, suggesting undersupply despite concurrent new vehicle market sales records.
Cox Automotive Australia’s Market Days’ Supply retail benchmark is 70 days, as measured over the preceding 45 days.
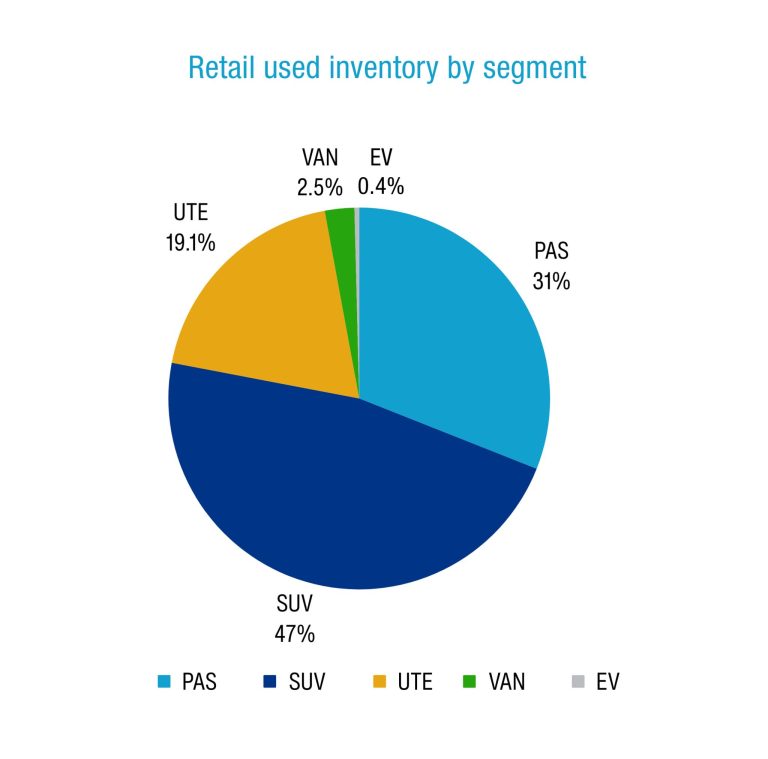
Of all used vehicles in dealer stock, 47.0% are SUVs, 31.0% are passenger cars, and 21.6% are light commercial utes and vans. Just 0.4% of used vehicles in dealers are an EV or PHEV.
The most-listed models are the Ford Ranger (up 0.1% for the month), Toyota HiLux (+0.8%), Toyota Corolla (+3.3%), Toyota RAV4 (-2.2%, the only vehicle in negative territory) and Mitsubishi Triton (+2.8%).
Dealer used vehicle prices
As mentioned at the top, the Cox Automotive Australia Used Vehicle Price Index ticked upwards in February to 137.1, the highest it has been since October 2023, and the first monthly increase in 12 months.
Average used vehicle prices on the Index are down 6.9% over this time last year, meaning greater affordability on the back of greater supply year-over-year.
The data also shows that 36.6% of used cars sold by dealers in February 2023 received a discount before selling, by comparing the original listing price and the eventual delisting price. The average discount was 6.8%, compared to 7.0% the previous month.
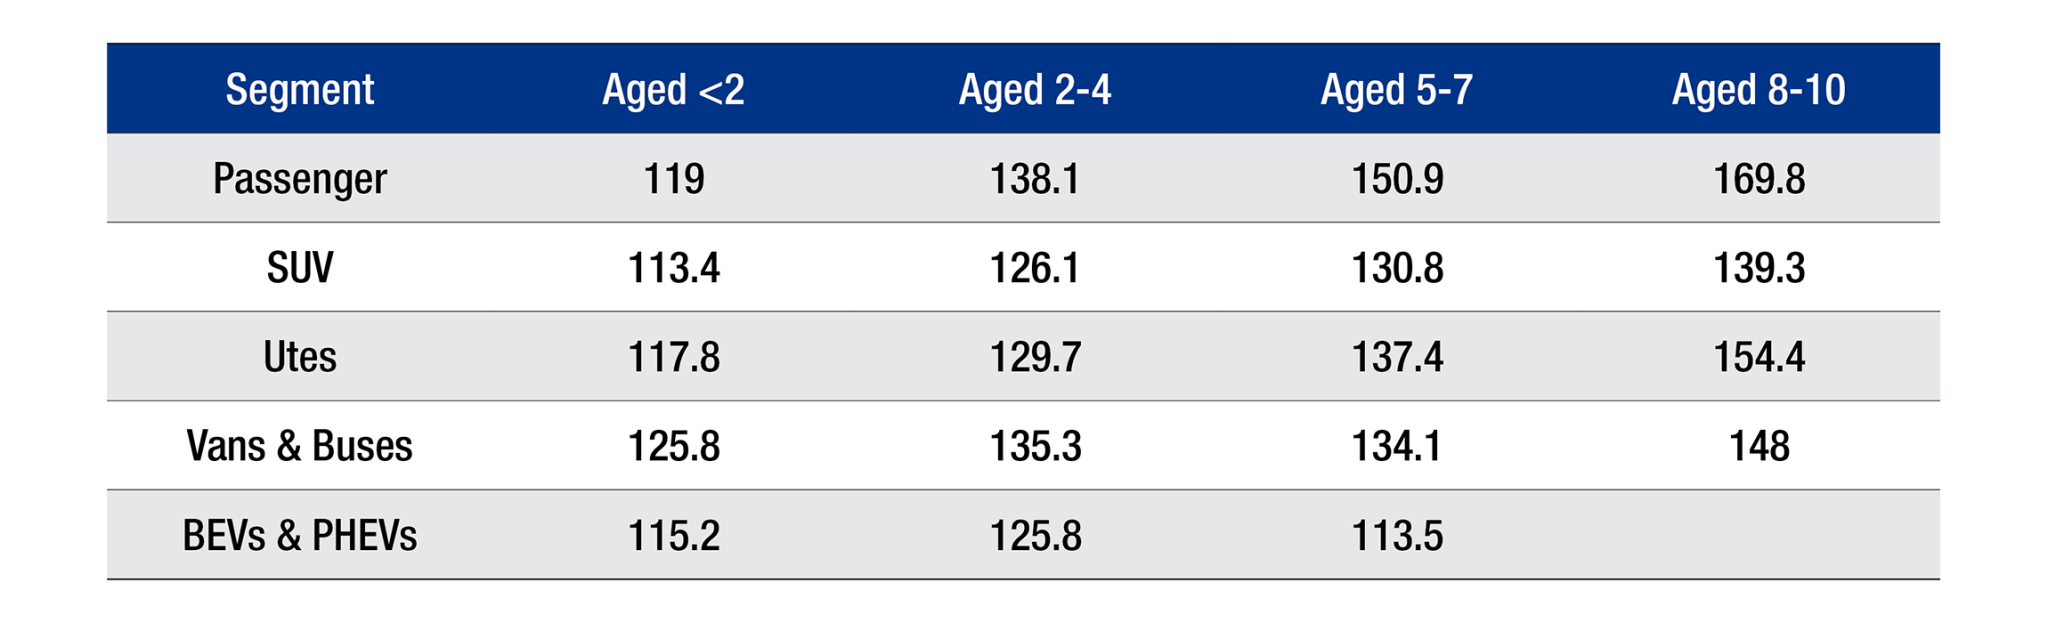
There remain significant discrepancies in Price Indexes across vehicle types. The Passenger segment is 147.1 on the Index, compared to 128.9 for SUVs, 136.7 for Utes, and 137.6 for Vans & Buses.
This means that on average, used passenger cars are 47.1% more expensive (volume-weighted and adjusted by MSRP) than pre-COVID, compared to 28.9% for SUVs and 36.7% for Utes.
Used EVs and PHEVs have a Price Index of 118.2, lower than the average for the whole market. But the data set remains small, and as a result changes month-over-month are comparatively volatile.
There is also a strong correlation between vehicle age and Price Index, with older vehicles staying inflated by heightened demand for traditionally more affordable vehicles aged 8+ years, pushing up prices.
Tracking the Used Price Indexes by segment across age brackets:
Manheim wholesale used update
Manheim Australia auction sales volume hit the highest monthly total since August 2020, growing 11.5% over the previous month and 37.9% over February 2023.
The top-selling auction vehicles were the Ford Ranger (+28.2%), Toyota Camry (+75.0%, many being de-fleeted ex-government cars), Mitsubishi Triton (+44.4%), Toyota Corolla (+23.1%), and Toyota HiLux (+80.0%).
As with the retail used market, wholesale prices across the market also went up, by 3.0% for the month as per the Manheim Price Index, to 142.6. Given wholesale auctions are a key procurement channel for retail dealers, there’s a clear link between price movements across the sectors.
For context though, the Manheim Sold Price Index of 142.6 is down 15% since the market peaked in May 2022, something vendors should consider.
There remain significant discrepancies in Manheim Sold Price Indexes across vehicle types, however. The Passenger segment is 163.2 on the Index, compared to 130 for SUVs, 140.7 for Utes, and 145 for Vans & Buses. EVs and PHEVs have a healthy Index of 147.5, however the same size is very small (0.1% of total monthly volume).
Of all used vehicles sold at Manheim weekly auctions in February, 34.7 were SUVs, 33.4% were passenger cars, and 31.8% were light commercial utes and vans – quite a different make-up to the retail used market.

Top vehicles by supply
- Ford Ranger: Up 0.1%
- Toyota HiLux: Up 0.8%
- Toyota Corolla: Up 3.3%
- Toyota RAV4: Down 2.2%
- Mitsubishi Triton: Up 2.8%
Top-selling used vehicles
- Ford Ranger: 12.1%
- Toyota HiLux: Up 10.5%
- Toyota Corolla: Up 3.7%
- Toyota RAV4: Up 7.7%
- Hyundai i30: Up 0.3%
About Cox Automotive Australia
Cox Automotive Australia is a subsidiary of Cox Automotive US, the world’s largest automotive services and technology provider. Our local team of more than 500 people work with 23 auto OEMs, as well as an array of dealers, insurers, financiers, and private and public fleet sectors.
Our parent company has 29,000 employees on five continents and a family of trusted brands that operate across the globe. Cox Automotive is a subsidiary of Cox Enterprises Inc., a privately-owned, Atlanta-based company with $22 billion in annual revenue.
Our brands in Australia include Manheim Auctions (passenger, industrial and salvage), Kelley Blue Book, Sell My Car, and digital retailing solutions including LeadDriver and Xtime, an aftersales customer management platform used by Australia’s top OEMs in their networks.

For further information, please contact:
Mike Costello – Corporate Affairs Manager
M:+61 405 321 807 | E: mike.costello@coxautoinc.com
Read the latest full Market Insights Report Oct – Dec 2023 here
Definitions
Used Car Price Index
The Price Index tracks the movement of transaction prices relative to December 2019. It was created by taking the sold price of the used vehicles (from Dealers for the Retail Index or through Manheim auctions for the Wholesale Index), adjusted by the original Recommended Retail Price (RRP) when the vehicle was bought brand new, and volume weighted.
The base period is December 2019 with a value of 100 points. For example, an Index of 144.2 in May 2023 indicates that overall, the sold price has increased by 44.2% compared to December 2019.
Note that in calculating the index, the following vehicles are excluded:
- Brand new or heavy commercial vehicles;
- Vehicles that have travelled more than 60,000 km per year;
- Vehicles with more than 300,000 km;
- Vehicles less than two years old or more than 10 years old (for the Manheim Wholesale Used Car Price Index);
- Vehicles over 15 years old (for the Retail Dealer Used Car Price Index).
Active Listings
Level of dealer used and demo car stock in the reporting period. Active Listings represents a significant portion of used vehicle inventory advertised by Dealers nationally at the end of June 2023.
Sold Vehicles (Delisted)
Total Year-to-Date number of Dealers’ Used & Demo Vehicles delisted from advertisement in the reporting period which is assumed as sold.
Market Days Supply
Measuring the Supply & Demand dynamic by dividing the total number of Used Active Listings by the total number of vehicles sold within the last 45 days. 70 days MDS is the industry benchmark. MDS higher than 70 indicates over supply and vice versa.
Days to Sell
Dealers’ Demo & Used – Average Days to Sell measures the duration (in days) between when a vehicle was first advertised to when it was sold.