
How is the retail dealer used market tracking?
Average used car sales prices in Australian dealers fell a further 0.9% during May 2024 and are now 6.8% lower on average than this time last year, new data from Cox Automotive Australia (CAA) shows.
While sales of dealer-listed used vehicles grew 6.7% for the month, total dealer used and demonstrator inventory hit its second-highest level in the past 12 months.
Meanwhile the wholesale auction market continues its recovery in terms of sales volume, with Manheim Australia recording the highest passenger and light commercial monthly volume in almost four years.
Strong OEM, fleet-management, government and dealer volumes drove Manheim’s monthly auction sales results, which were up 10.3% MoM and 40.6% YoY. Manheim auction sales volume is now up 40.3% YTD.
Dealer used vehicle sales
The number of used and demonstrator vehicles actively listed in retailers grew 2.3% month-on-month (MoM) in May as inventory swelled to its highest since November 2023, up 16.1% year-on-year (YoY).
The used vehicle numbers cited come from the CAA retail database, which comprises a statistically significant proportion of Australia’s total dealer-used vehicle market.
Almost half of all dealer used and demo listings (47.7%) are SUVs, 30.2% are traditional passenger vehicles, and 21.6% are light commercial utes and vans.
Just 0.5% of listings are an EV or PHEV, as the market awaits the first significant wave of pre-owned battery-powered vehicles. In the meantime, CAA and Manheim are ensuring our EV readiness.
Despite better supply overall Market Days’ Supply ended May at 64 days, down from 65 days in April and below the CAA benchmark of 70 days. As recently as December 2023 the MDS figure was 68 days.
The top five most-stocked vehicles in dealer used inventories are the Ford Ranger (stock up 3.7% MoM), Toyota Hilux (down 1.3%), Toyota Corolla (up 11.4%), Toyota RAV4 (up 13.7%), and Mitsubishi Triton (up 4.6%).
Reflecting the return of supply into the new vehicle pipeline, availability of late-model used Toyota RAV4s increased significantly, with inventory swelling 16.1% MoM for examples aged under 2 years, and 23.9% for those aged 2-4 years.
Dealer used vehicle supply
Dealer used and demo vehicle sales were up 6.7% MoM and 4.9% YoY, and on a YTD basis are 9.3% higher than the same period in 2023. The aligns fairly closely to new market growth of 12.2% YTD.
Driven by strong inventory levels and more discounts on the new vehicle side, dealer-used transaction prices fell for a third straight month and on a marketwide basis are the lowest they have been on average since late 2021.
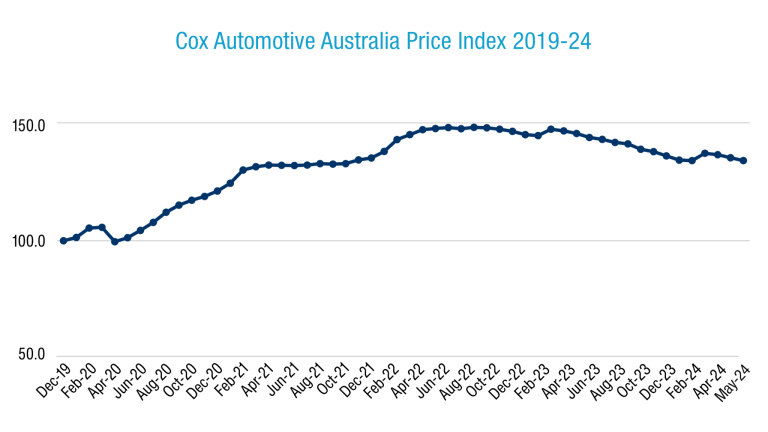
CAA measures price changes through the CAA Dealer Used Vehicle Delisted Price Index, which tracks average sale prices compared to a baseline period of 100 points in December 2019.
The Index currently sits at 134, denoting an average 34% used sale price increase (volume-weighted and adjusted by new MSRP) including inflation between December 2019 and May 2024.
For a little context the Index is down 6.8% YoY, and down 9.5% from the all-time high price Index of 148.1 which was hit during August 2022, when COVID-era shortages were biting hard.
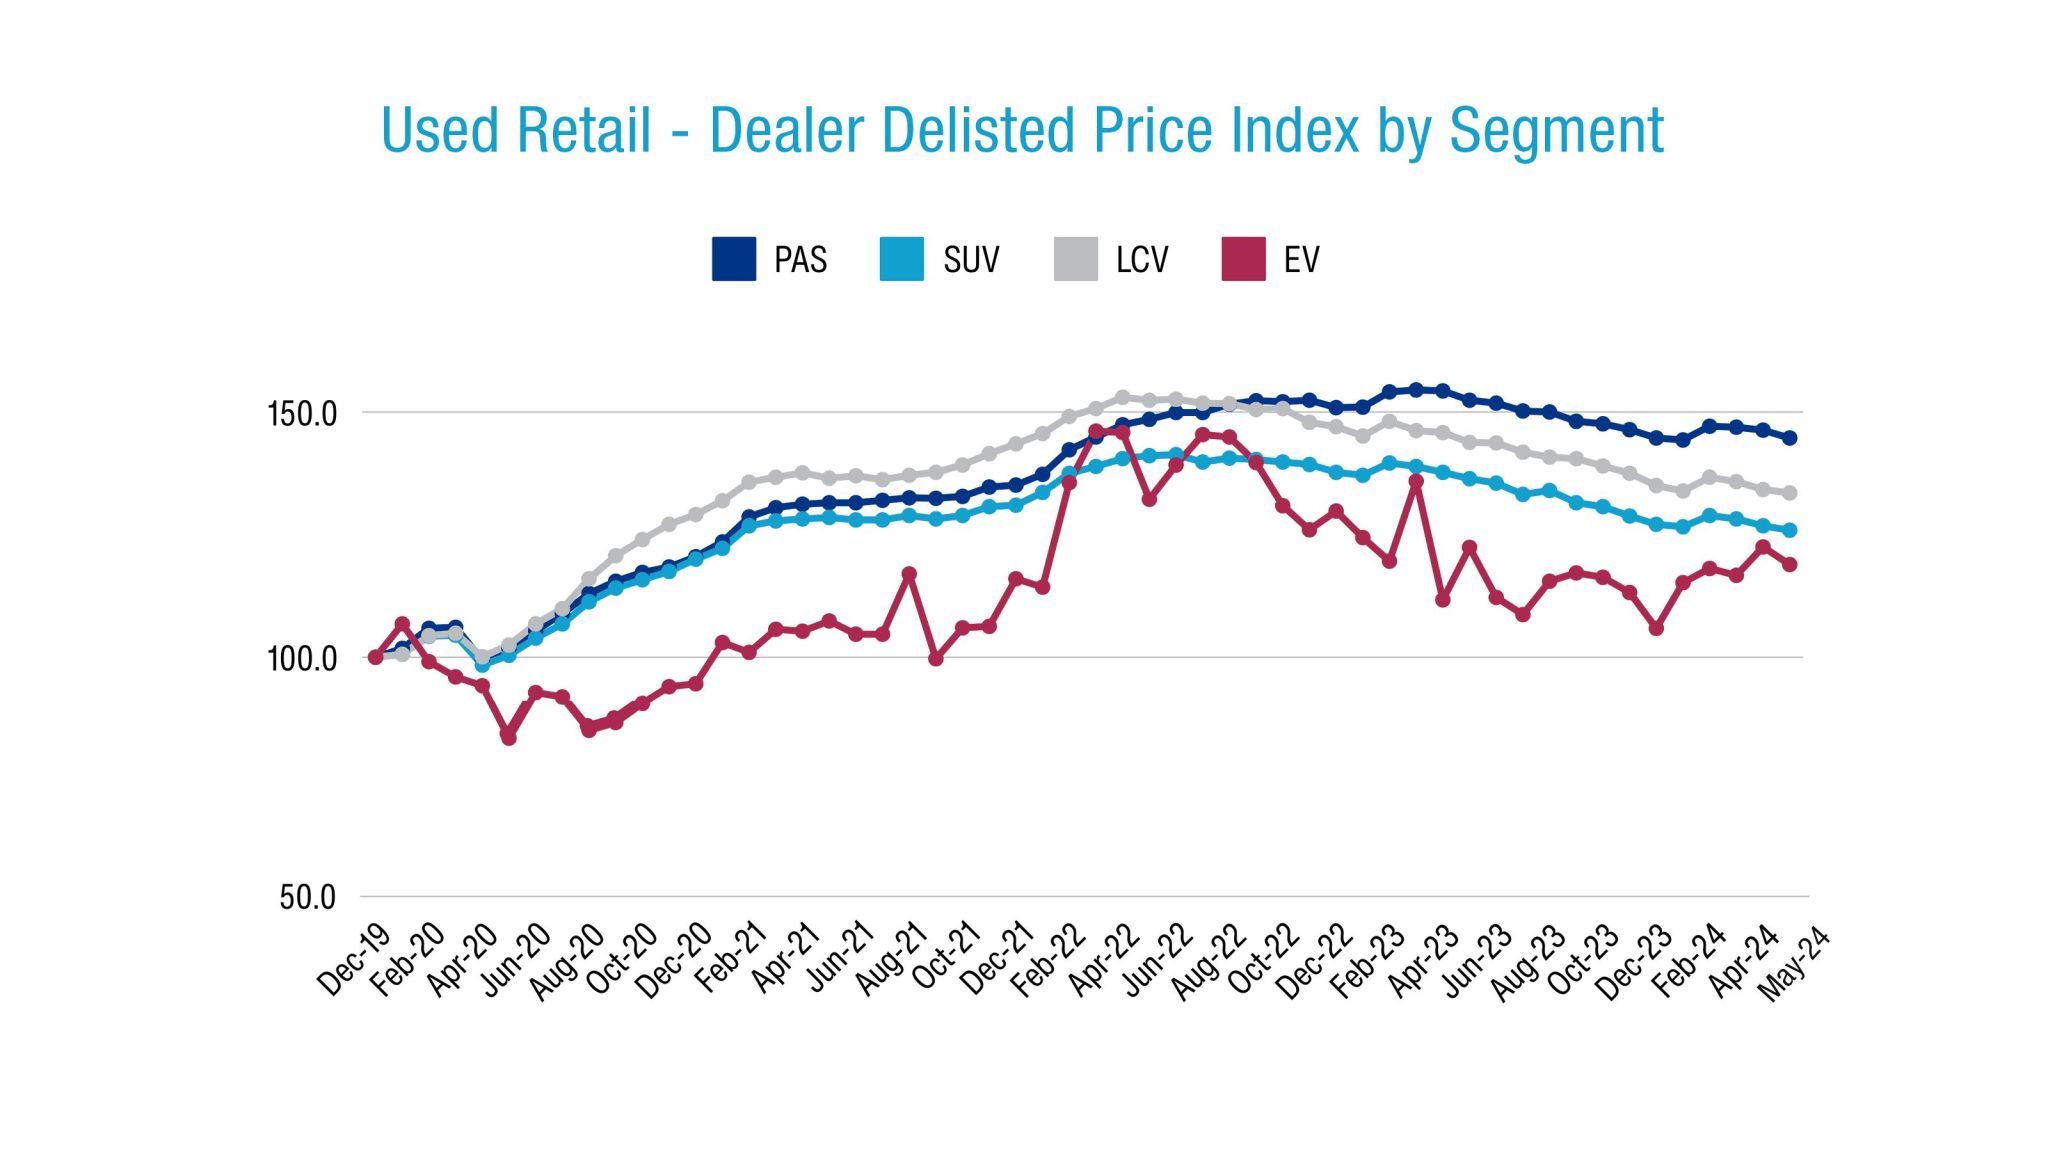
Some 47.8% of dealer used sales in May were SUVs, 30.9% were passenger cars, 21% were light commercials, and 0.3% were BEVs and PHEVs. Across all segments, 39.7% of sold used vehicles received some level of price cut between listing and sale, by an average of 7.0% per unit.
The top five used vehicles sold regardless of age were the Ford Ranger (up 12.9% MoM), Toyota HiLux (up 13.5%), Toyota Corolla (down 2.7%), Toyota RAV4 (up10.6%), and Mitsubishi Triton (up 10.8%).
Digging a little deeper, we saw sales of used Toyota RAV4s aged under 2 years hike 19.2% MoM, sales of Toyota Camrys aged 5-7 years increase by 32% MoM, and sales of Ford Rangers aged 8-10 increase by 20.9%.
As has become a familiar trend, there are discrepancies in the CAA Price Index of vehicles depending on their age and their segment, with older vehicles and traditional low-riding passenger hatches and sedans the most inflated relative to December 2019, as the table below shows:
Manheim wholesale used update
Manheim auctions had a strong May result in terms of sales volumes, driven by a healthy supply of desirable ex-government vehicles, onboarding a number of new dealer customers, and healthy volumes from fleet management organisations (FMOs) that use Manheim auctions for asset disposal.
The May 2024 result was the strongest since mid-2020, as physical and digital auction volumes returned towards pre-COVID levels. The largest sources of vehicles sold through Manheim’s national auctions came from dealers, OEMs, FMOs, and government fleet departments such as councils.
Meanwhile, Cox Automotive Australia’s public-facing car buying service Sell My Car achieved its best result in terms of volume delivered to auctions since September 2017. This in particular drives much of the vibrancy we are seeing in Manheim’s clearance lanes, focusing on older and more affordable stock.
Meanwhile average wholesale transaction prices continue to slowly return to earth after spiking during COVID. The Manheim Wholesale Price Index sits at 136, denoting an average 36% price increase on wholesale vehicles of all types and ages since December 2019.
This Index is down 8.4% YoY and down 18.9% since the wholesale market peaked in May 2022. The message both to vendors as well as prospective wholesale auction buyers (dealers and the public) is that average purchase prices in this market are down almost 20% over the past two years.
The top five most purchased vehicles at Manheim auctions in May were the Ford Ranger (up 17.7% MoM), Toyota Camry (up 19%), Isuzu D-Max (down 9.5%), Toyota Corolla (even), and Holden Colorado (up 2.0%).
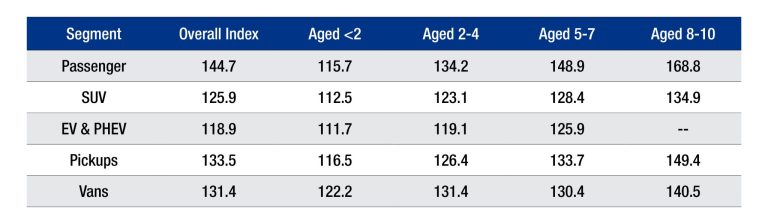
The number denotes the % increase over the December 2019 100-point baseline. Ergo, overall Passenger Cars are up 44.7% since December 2019 and SUVs are up 25.9%. Note that older vehicles tend to remain proportionately more inflated relative to pre-COVID prices.
About Cox Automotive Australia
Cox Automotive Australia is a subsidiary of Cox Automotive US, the world’s largest automotive services and technology provider.
Our local team of almost 600 people works with 26 automotive OEMs, as well as an array of automotive dealers and with the private and public fleet sector. Our parent company has 29,000 employees on five continents and a family of trusted brands that operate across the globe.
Cox Automotive is a subsidiary of Cox Enterprises Inc., a privately-owned, Atlanta-based company with $22 billion in annual revenue working in multiple industry sectors.
Our brands in Australia include Manheim Auctions (passenger, industrial and salvage), Kelley Blue Book, Sell My Car, and digital retailing solutions including LeadDriver and Xtime – an aftersales customer management platform used by several of Australia’s top OEMs in their dealer networks.
Manheim holds in-person and online wholesale vehicle auctions across Australia and New Zealand, with unique auction driving lanes in Melbourne, Brisbane and Sydney. Moreover, Manheim is a major salvage company for the insurance sector, and a major heavy industrial auctioneer.

For further information, please contact:
Mike Costello – Corporate Affairs Manager
M:+61 405 321 807 | E: mike.costello@coxautoinc.com
Read the latest full Market Insights Report Jan- Mar 2024 here
Definitions
Used Car Price Index
The Price Index tracks the movement of transaction prices relative to December 2019. It was created by taking the sold price of the used vehicles (from Dealers for the Retail Index or through Manheim auctions for the Wholesale Index), adjusted by the original Recommended Retail Price (RRP) when the vehicle was bought brand new, and volume weighted.
The base period is December 2019 with a value of 100 points. For example, an Index of 144.2 in May 2023 indicates that overall, the sold price has increased by 44.2% compared to December 2019.
Note that in calculating the index, the following vehicles are excluded:
- Brand new or heavy commercial vehicles;
- Vehicles that have travelled more than 60,000 km per year;
- Vehicles with more than 300,000 km;
- Vehicles less than two years old or more than 10 years old (for the Manheim Wholesale Used Car Price Index);
- Vehicles over 15 years old (for the Retail Dealer Used Car Price Index).
Active Listings
Level of dealer used and demo car stock in the reporting period. Active Listings represents a significant portion of used vehicle inventory advertised by Dealers nationally at the end of June 2023.
Sold Vehicles (Delisted)
Total Year-to-Date number of Dealers’ Used & Demo Vehicles delisted from advertisement in the reporting period which is assumed as sold.
Market Days Supply
Measuring the Supply & Demand dynamic by dividing the total number of Used Active Listings by the total number of vehicles sold within the last 45 days. 70 days MDS is the industry benchmark. MDS higher than 70 indicates over supply and vice versa.
Days to Sell
Dealers’ Demo & Used – Average Days to Sell measures the duration (in days) between when a vehicle was first advertised to when it was sold.