
How is the retail dealer used market tracking?
- National dealer used car inventory in the CAA database is 24.2% greater now than at this time in 2023.
- Dealer used vehicle sales growth has been slower, seeing average sale prices come down 7.1% YoY.
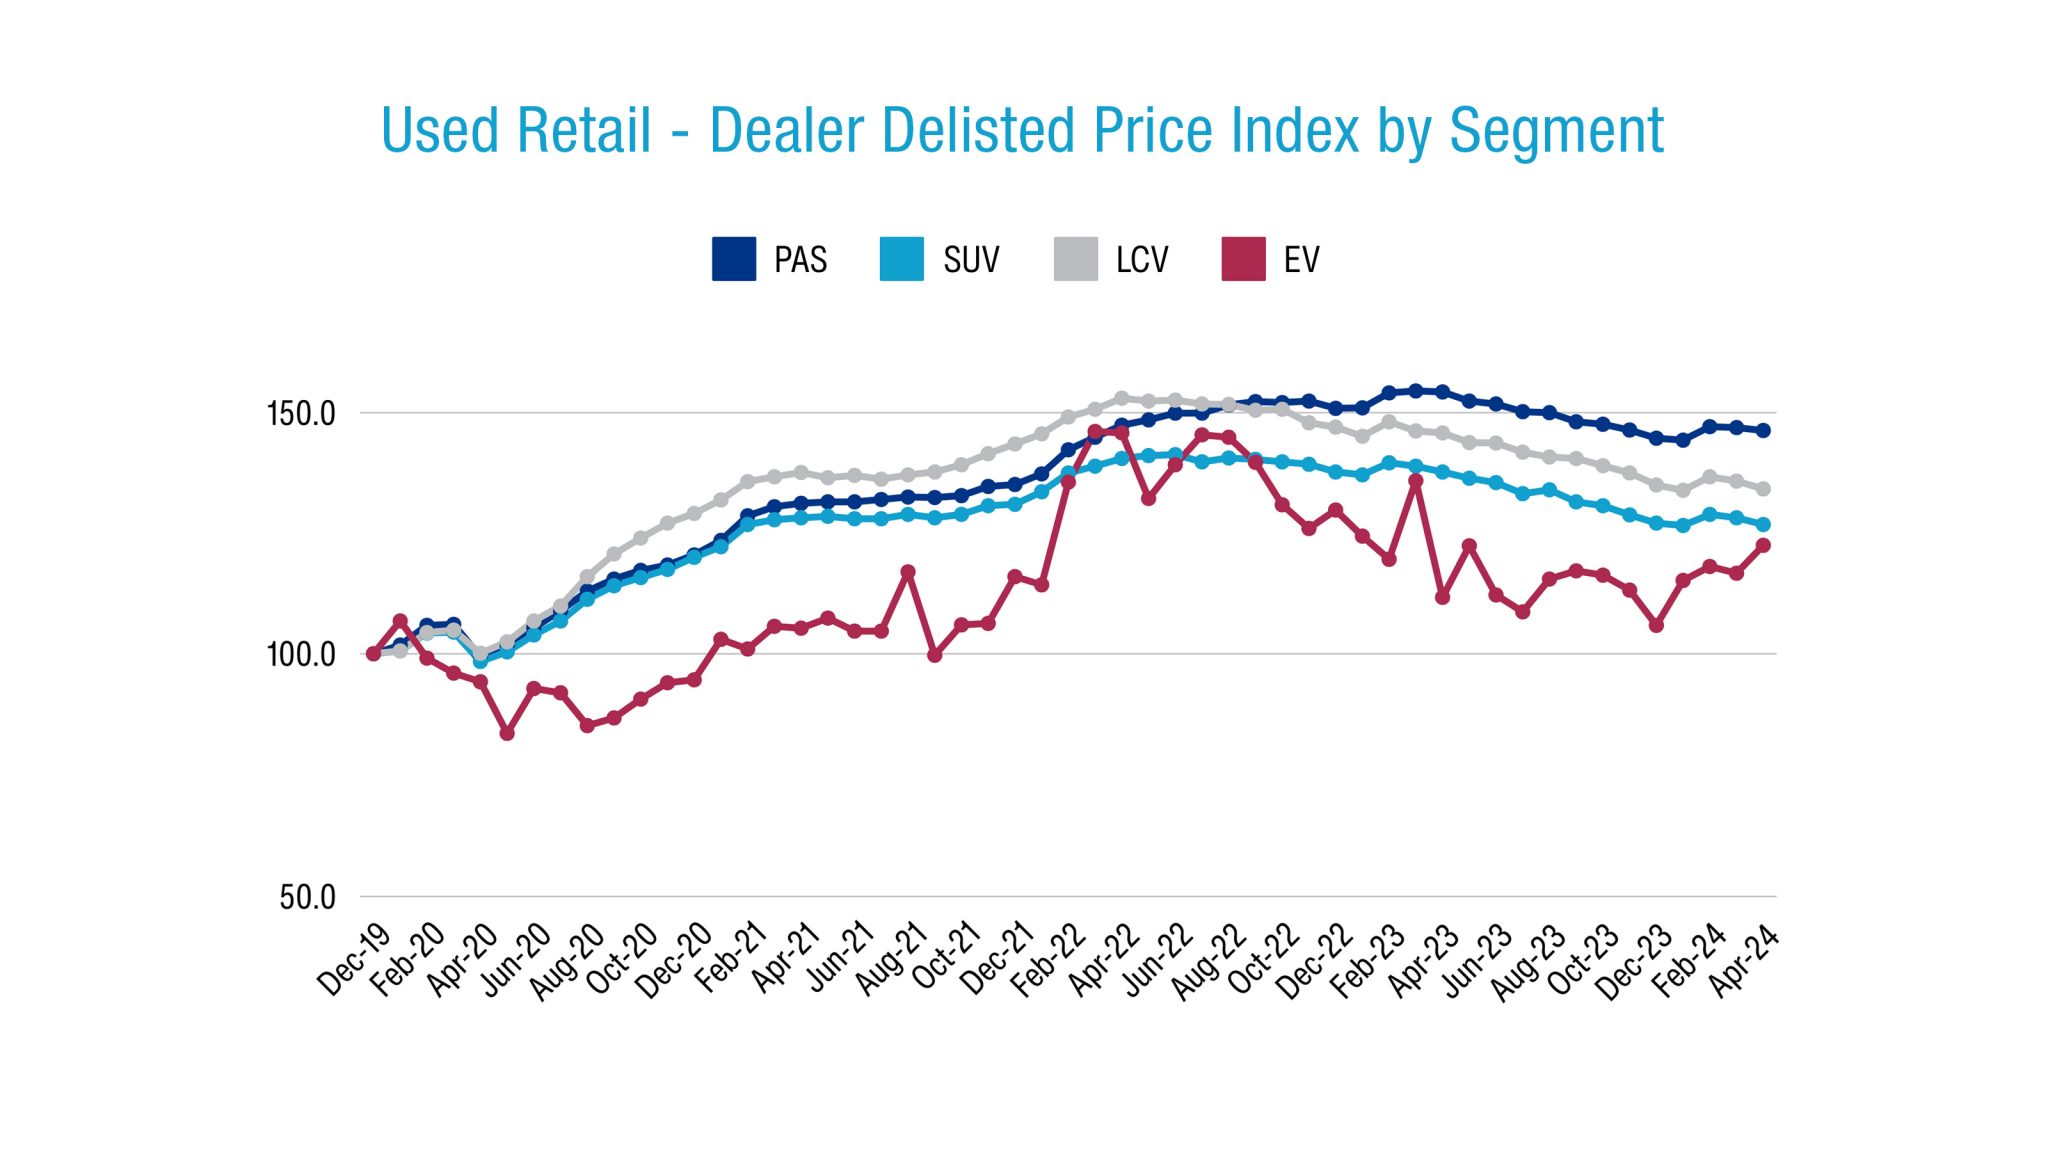
- Lower-riding passenger vehicles and older used vehicles remain more inflated on the Cox Automotive Australia Used Price Index than SUVs, light commercials, and younger used cars.
- The Cox Automotive Australia retail database tracks a statistically significant percentage of the total domestic used vehicle market in terms of units listed and delisted, making it a valuable resource.
Dealer used vehicle sales
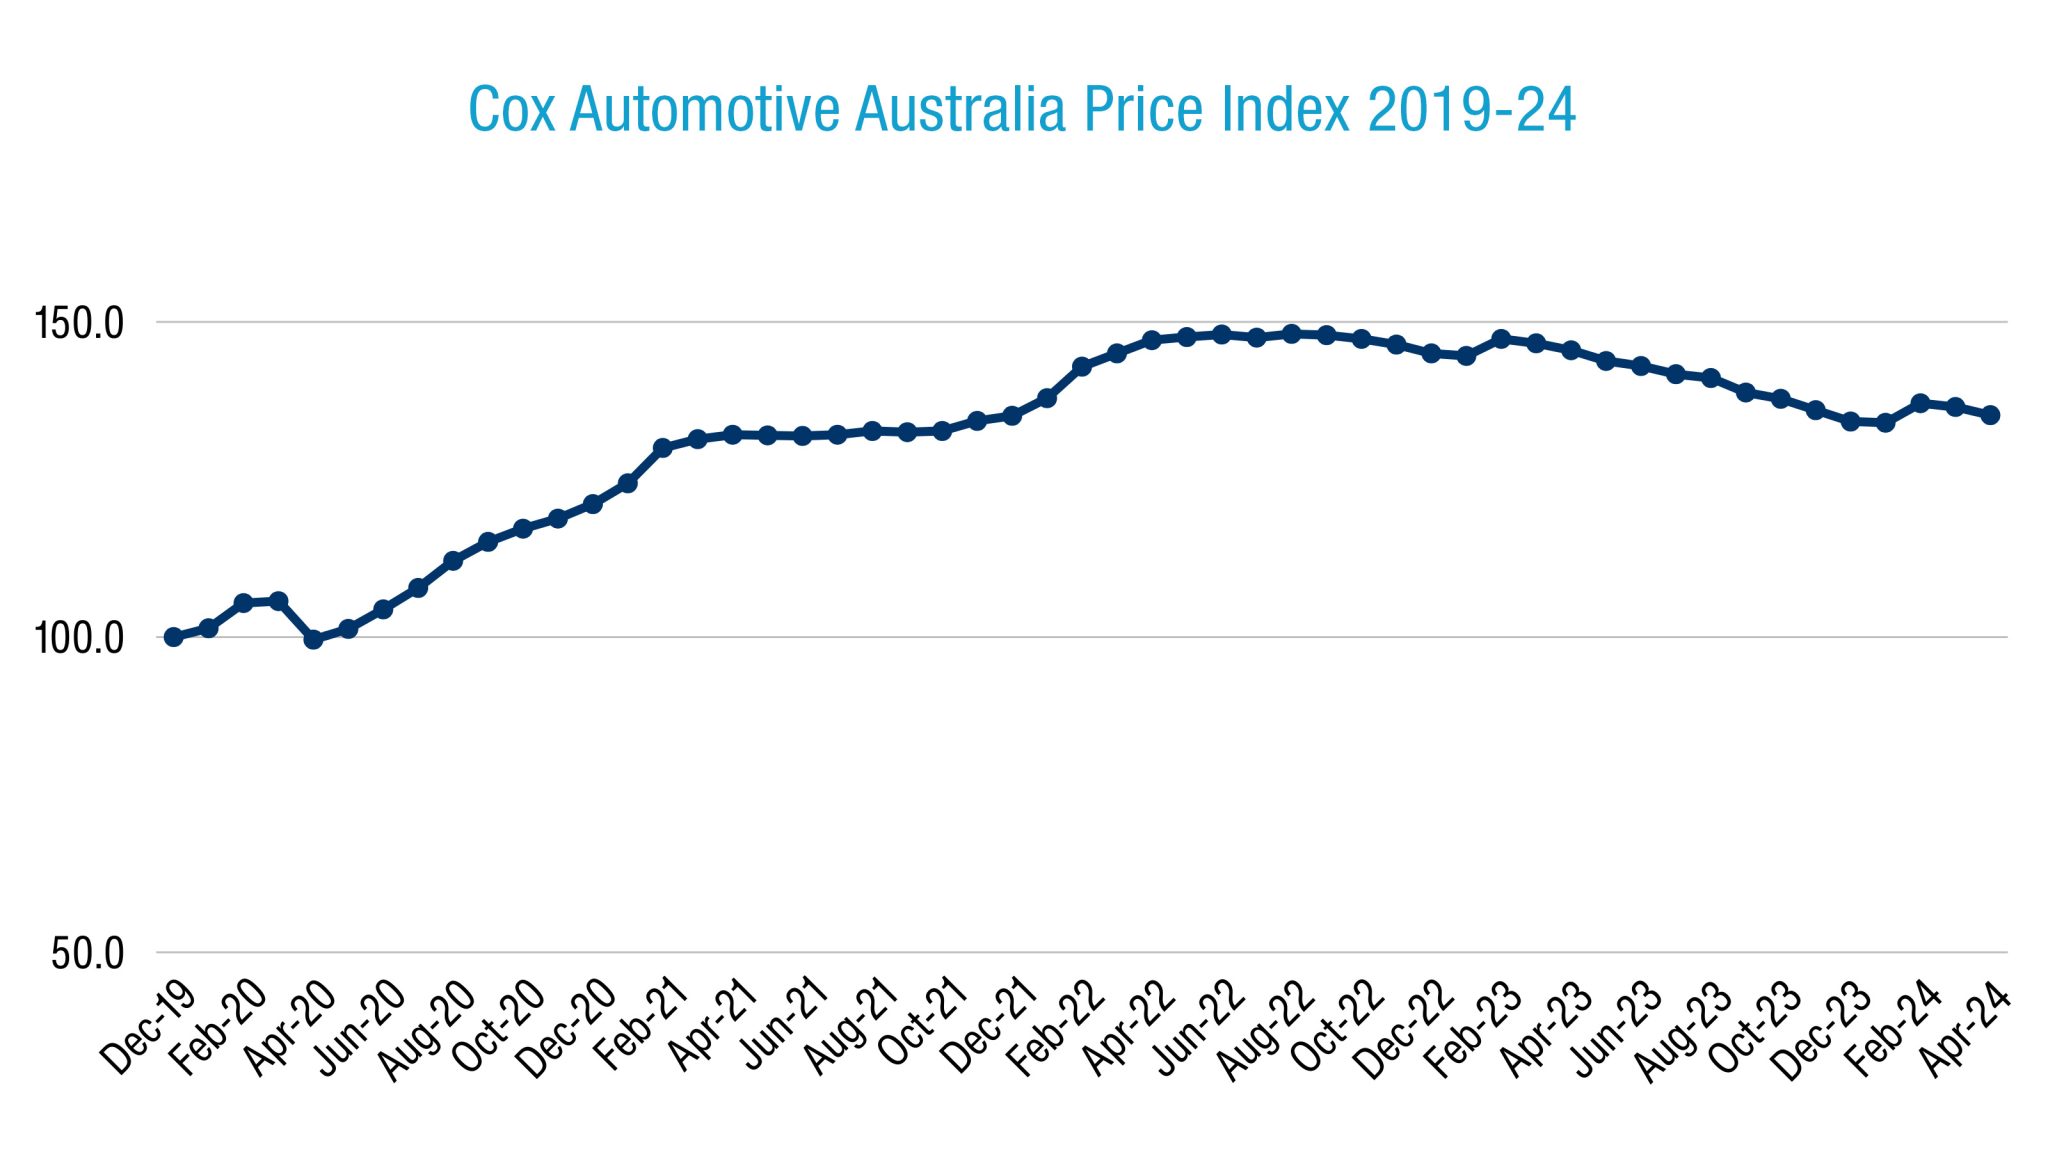
Dealer used vehicle selling prices across Australia fell 1.0% in April 2024 over the previous month, with retail supply outpacing demand according to new data from Cox Automotive Australia.
The Cox Automotive Australia Dealer Delisted Price Index for used and demonstrator cars finished April on 135.2, down 1.0% month-over-month (MoM) and 7.1% year-over-year (YoY).
This denotes an average 35.2% price increase per vehicle between the Index baseline of December 2019 and today, including inflation, volume-weighted and adjusted by MSRP. The Index peaked at 148.1 in August 2022, and has fallen 8.7% since then.
More used cars entered the dealer market in April than exited it, with market-wide available inventory in the Cox Automotive Australia database up 3.1% MoM and a healthy 24.2% YoY. At the same time dealer used and demonstrator sales for April 2024 declined 0.4% MoM and grew at a more modest 9.7% YoY.
The discrepancy between inventory and sales growth saw Market Days’ Supply of used vehicles climb from 62 days in February 2024, to 63 days in March, to 65 days in April. This sits below Cox Automotive’s benchmark figure of 70 days.
The continued softening of used vehicle prices – with notable exceptions to be detailed shortly – are the result of improved vehicle supply (both used and new) and growing household budget pressures.
Of all sold dealer used and demonstrator cars for the month, 38.8% of them received a price cut between listing and sale, by an average of 6.8%. This figure was 6.7% in the previous month.
As of May 1, the most listed vehicles in Cox Automotive Australia’s dealer database were the Ford Ranger (up 7.5% MoM), Toyota HiLux (up 2.6% MoM), Toyota Corolla (up 6.3% MoM), Toyota RAV4 (up 7.0% MoM), and Mitsubishi Triton (up 5.4% MoM).
Dealer used vehicle supply
Breaking down current dealer used vehicle inventories by segment, 47.5% are an SUV, 30.2% a traditional passenger car such as a sedan or hatchback, 19.5% are a pickup or ute, 2.5% are vans or buses, and 0.5% are BEV or PHEV – not a surprise given most EVs remain with their first owners.
Dealer used vehicle prices
During April, the top-selling vehicles in Cox Automotive Australia’s dealer database were the Ford Ranger (down 1.7% MoM), Toyota Corolla (up 5.4% MoM), Toyota HiLux (up 1.0% MoM), Toyota RAV4 (up 6.2% MoM), and Hyundai i30 (down 3.9%).
Breaking down dealer used vehicle sales in April by segment, 47.5% were SUVs, 31.3% traditional passenger cars, 18.7% pickups/utes, 1.8% vans or buses, and 0.4% BEV or PHEV.
As has become a pattern, prices are comparatively inflated on second-hand passenger cars, as well as older stock.
For example, the overall Price Index of passenger cars is 146.3, meaning an average 46.4% price increase for passenger-type used vehicles between December 2019 and today. By contrast the overall SUV Price Index is currently 126.8, the overall Ute Price Index is 134.2, and the overall Van Price Index is 136.7.
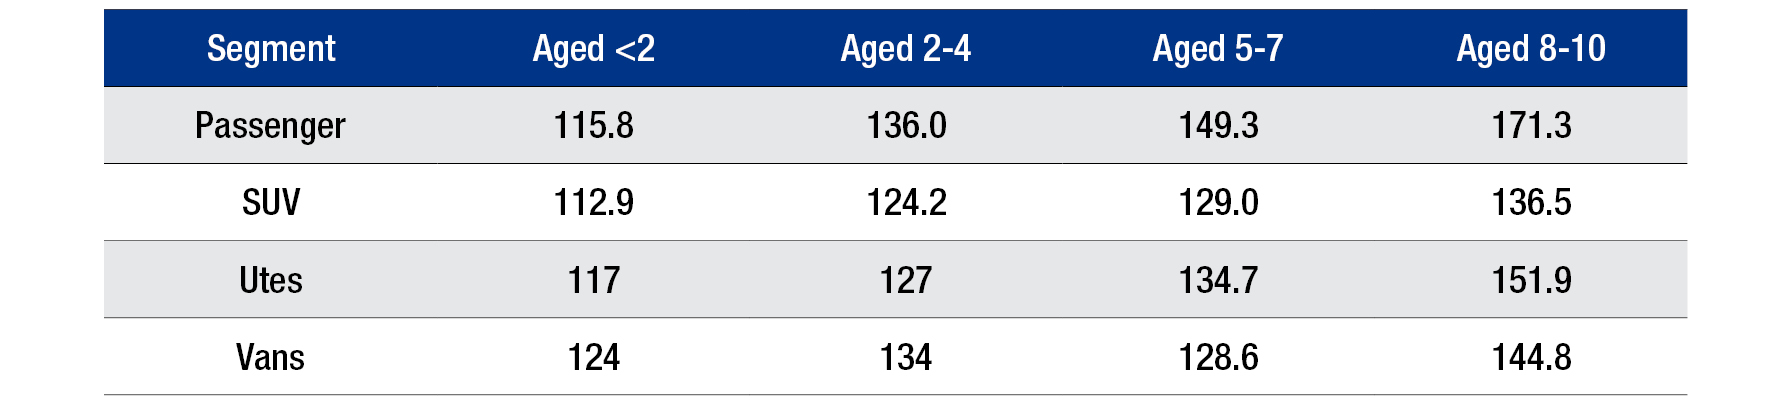
From an age perspective, we consistently see vehicles in the older age brackets such as 5-7 years and 8-10 years retain more inflated Price Indexes than newer equivalents. This does not mean older cars are more expensive than newer cars, but rather says they are more inflated relative to their pre-COVID prices.
In other words, their inflated retail prices are stickier and buffeted less by what’s impacting the market.
For example, we know that supply of newer hatchbacks and sedans is limited on account of their rapid sales contraction in the new market over the past few years during the SUV boom, causing shortages in the used sector as a knock-on effect and subsequently causing more price inflation.
In a similar vein, older vehicles are in higher demand than younger used vehicles in more households due to inflation and interest rate pressures on households. As more buyers opt for an older option at a lower starting price, it keeps said prices more inflated than they may be otherwise.
As the table below illustrates, passenger vehicles sold used under 2 years of age are on average retailing for 15.8% more today than December 2019, whereas those aged 2-4 are selling for 36% more than December 2019, and those aged 8-10 are selling for 71.3% more today than pre-pandemic.
Top 5 sold vehicles – April
- Ford Ranger: -1.7% MoM
- Toyota Corolla: +5.4% MoM
- Toyota HiLux: +1.0% MoM
- Toyota RAV4: +6.2% MoM
- Hyundai i30: -3.9%
Top 5 listed vehicles – April
- Ford Ranger: +7.5% MoM
- Toyota HiLux: +2.6% MoM
- Toyota Corolla: +6.3% MoM
- Toyota RAV4: +7.0% MoM
- Mitsubishi Triton: +5.4% MoM
Manheim wholesale used update
In addition to its dealer retail used database, Cox Automotive Australia closely monitors the wholesale market through its Manheim auctions, which remarket second-hand vehicles sourced from corporate and government fleets, fleet management firms, financiers, automotive OEMs, dealers, and the public.
Manheim’s nationwide physical and online auctions are open to anyone but have historically been an important channel for used vehicle dealers to obtain stock for their yards. This is why the wholesale and retail used markets are so closely intertwined, with one affecting the other and vice-versa.
Pleasingly, Manheim Australia passenger and light commercial auction sales have grown 40% YTD compared to the same January to April period in 2023, as the wholesale market edges towards pre-COVID volumes.
April volume also spiked a massive 85.2% over the corresponding month last year.
Average wholesale transaction prices at Manheim’s physical and online auctions have stabilised and even trended slightly up, having fallen consistently across 2023 from COVID-era highs.
The Manheim Price Index ended April at 142, denoting an average 42% wholesale price increase per vehicle since December 2019 including inflation. This is an increase of 3.0% since the start of 2024. Average auction sales prices are still more than 15% lower now than at the market’s peak of 167.1 in mid-2022 however.
About Cox Automotive Australia
Cox Automotive Australia is a subsidiary of Cox Automotive US, the world’s largest automotive services and technology provider.
Our local team of almost 600 people works with 26 automotive OEMs, as well as an array of automotive dealers and with the private and public fleet sector. Our parent company has 29,000 employees on five continents and a family of trusted brands that operate across the globe.
Cox Automotive is a subsidiary of Cox Enterprises Inc., a privately-owned, Atlanta-based company with $22 billion in annual revenue working in multiple industry sectors.
Our brands in Australia include Manheim Auctions (passenger, industrial and salvage), Kelley Blue Book, Sell My Car, and digital retailing solutions including LeadDriver and Xtime – an aftersales customer management platform used by several of Australia’s top OEMs in their dealer networks.
Manheim holds in-person and online wholesale vehicle auctions across Australia and New Zealand, with unique auction driving lanes in Melbourne, Brisbane and Sydney. Moreover, Manheim is a major salvage company for the insurance sector, and a major heavy industrial auctioneer.

For further information, please contact:
Mike Costello – Corporate Affairs Manager
M:+61 405 321 807 | E: mike.costello@coxautoinc.com
Read the latest full Market Insights Report Jan- Mar 2024 here
Definitions
Used Car Price Index
The Price Index tracks the movement of transaction prices relative to December 2019. It was created by taking the sold price of the used vehicles (from Dealers for the Retail Index or through Manheim auctions for the Wholesale Index), adjusted by the original Recommended Retail Price (RRP) when the vehicle was bought brand new, and volume weighted.
The base period is December 2019 with a value of 100 points. For example, an Index of 144.2 in May 2023 indicates that overall, the sold price has increased by 44.2% compared to December 2019.
Note that in calculating the index, the following vehicles are excluded:
- Brand new or heavy commercial vehicles;
- Vehicles that have travelled more than 60,000 km per year;
- Vehicles with more than 300,000 km;
- Vehicles less than two years old or more than 10 years old (for the Manheim Wholesale Used Car Price Index);
- Vehicles over 15 years old (for the Retail Dealer Used Car Price Index).
Active Listings
Level of dealer used and demo car stock in the reporting period. Active Listings represents a significant portion of used vehicle inventory advertised by Dealers nationally at the end of June 2023.
Sold Vehicles (Delisted)
Total Year-to-Date number of Dealers’ Used & Demo Vehicles delisted from advertisement in the reporting period which is assumed as sold.
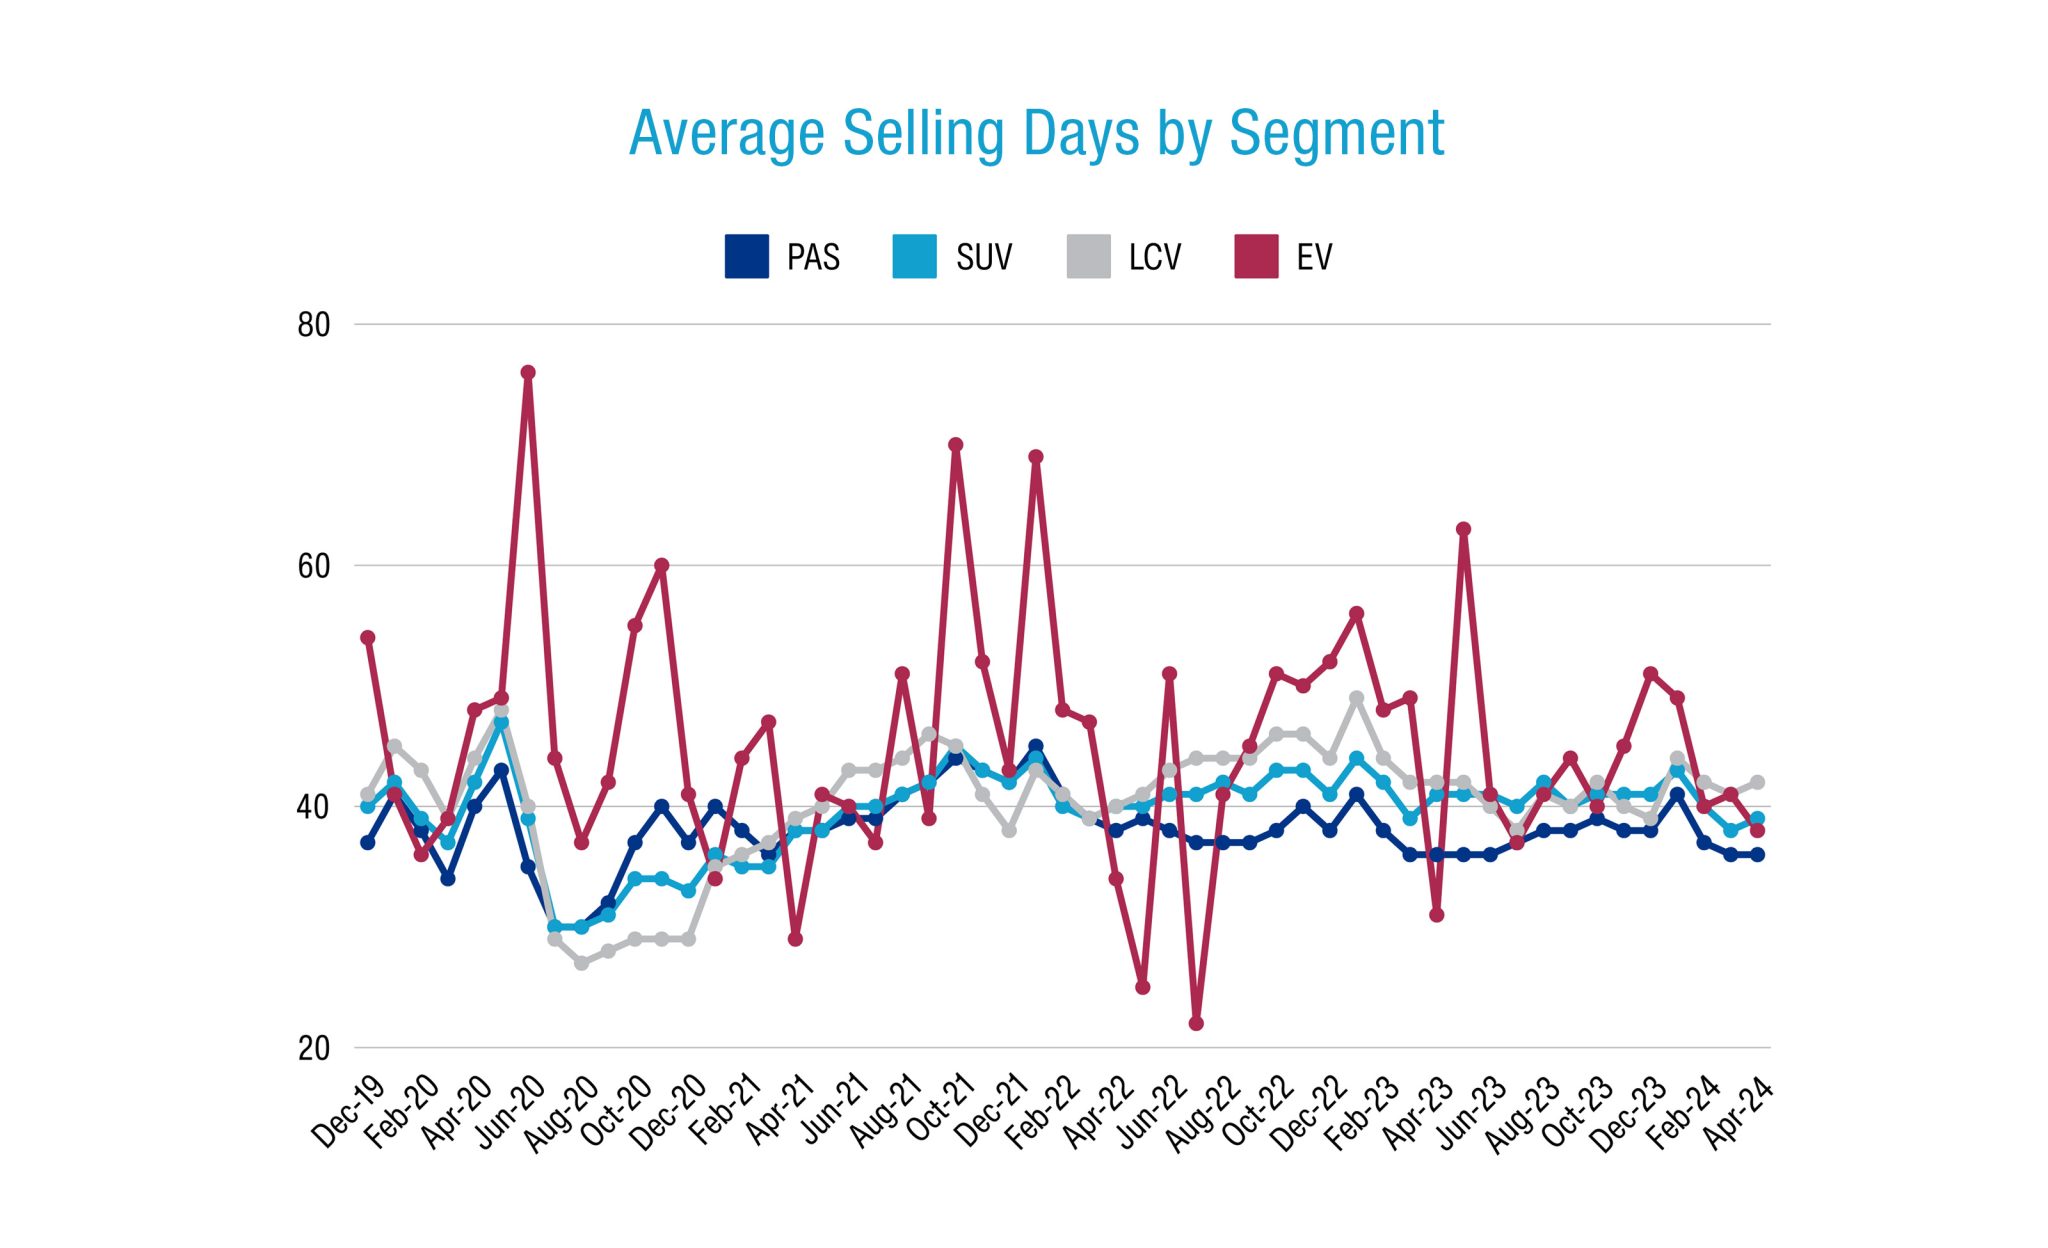
Market Days Supply
Measuring the Supply & Demand dynamic by dividing the total number of Used Active Listings by the total number of vehicles sold within the last 45 days. 70 days MDS is the industry benchmark. MDS higher than 70 indicates over supply and vice versa.
Days to Sell
Dealers’ Demo & Used – Average Days to Sell measures the duration (in days) between when a vehicle was first advertised to when it was sold.