
Retail used price movements
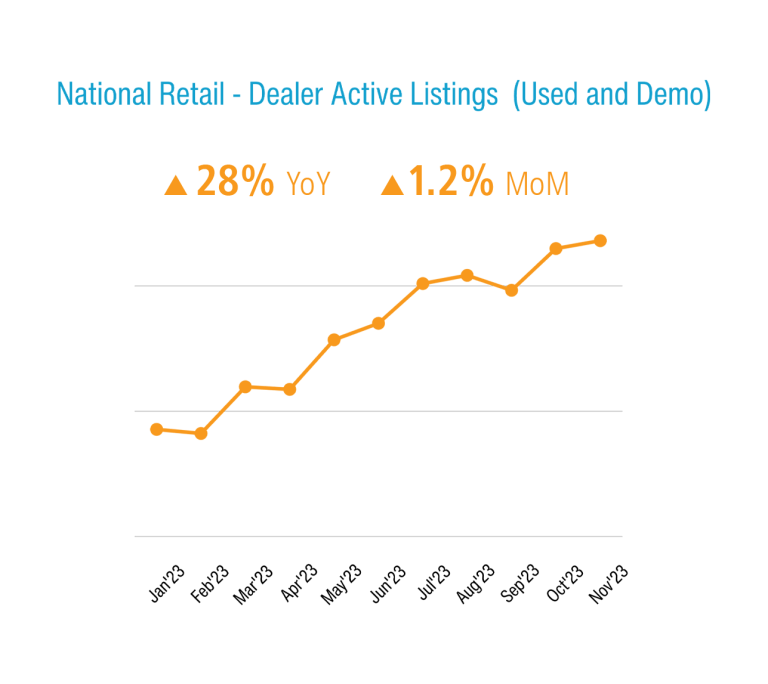
Dealer used and demonstrator vehicle inventories, on average, are at the highest level since March 2020, having increased by 28% over this time last year.
In fact, the number of active used and demonstrator vehicles in the Cox Automotive Australia (CAA) database sits 39% higher than at the end of January 2023.
More dealer used vehicle supply can be attributed in part to ongoing delivery records in the new car market, which is poised to top 1.2 million units, and subsequent vehicle trade-ins.
At the same time used vehicle sales are also growing, by 2.9% for the month and 16.4% year-on-year. On a year-to-date basis, used vehicle sales are up 11.6% over 2022.
The average number of days to sell a used vehicle is 41, down 6.3% over the same time last year.
Simultaneous increases in supply and demand meant stock levels, measured using Market Days Supply, were steady at 65 for the second month, below CAA’s 70-day benchmark.
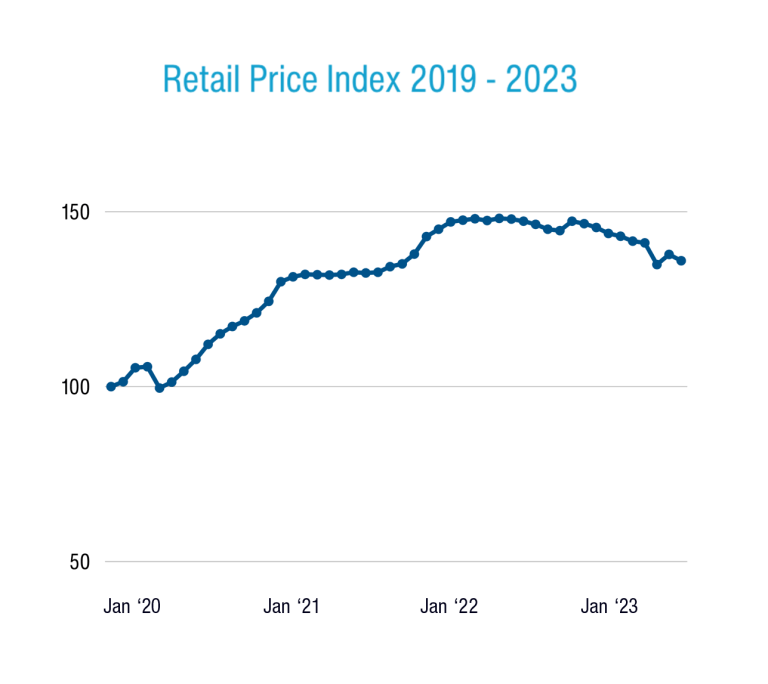
November was also the ninth straight month where used vehicle prices cooled on the CAA Dealer Delisted Price Index. The index of 136.0 is down 8.2% from the peak of 148.1 in August 2022.
This denotes that average used vehicle prices are 36% higher than they were in December 2019 (the 100-point base period), compared to being 48.1% higher at their peak.
Notably the used vehicles with average sale prices closest to their pre-COVID levels are those aged under 2 years, with consistently higher average price indexes seen across older age brackets.
Older and cheaper used vehicles are more inflated on the CAA index in part because we’re seeing higher demand for them, as households reduce budgets amid cost-of-living pressures.
On this theme, traditional passenger vehicles also have a much higher price index (146.4) than SUVs (128.8) and the overall market (136.0), reflected across all age brackets.
Over the past 12 months we have seen the price index of passenger cars decline by only 4.0%, compared to 7.5% for SUVs, 7.0% for pickups, and 10.2% for EVs and PHEVs.
Why might lower-riding hatchbacks and sedans be retaining higher relative used vehicle prices than SUVs? Likely a mix of greater demand due to lower upfront and running costs, and less supply since sales of new passenger cars have been steadily declining while SUV sales have been growing.
EV update
The number of used electric vehicles and plug-in hybrids in the CAA database is small – less than 0.5% of inventory – but their current price index (113.2, meaning average prices are up 13.2% since before COVID) is lower than any other vehicle types by 12% to 23%.
On the positive side, we’re seeing reduced volatility in the used EV and PHEV markets on the price index, which has hovered between 113 and 117 over the previous four months. This is a product of a larger data set.
Wholesale used insights update
In the wholesale market, prices also continue to decline while clearance volume is up.
CAA’s Manheim passenger and commercial vehicle (PCV) auctions volume grew 38.6% in November over the previous year, while year-to-date growth sits at a robust 25.4%.
Average wholesale selling prices are down across 2023, though they grew 0.9% MoM. The Manheim PCV price index now sits at 140.5, down about 10% over this time last year.
Long-running new vehicle shortages led to fleet organisations holding onto older cars for longer than usual, impacting the residuals when remarketed because these vehicles have higher mileage.
Read the latest full Market Insights Report Jul-Sep 2023 here
Definitions
Used Car Price Index
The Price Index tracks the movement of transaction prices relative to December 2019. It was created by taking the sold price of the used vehicles (from Dealers for the Retail Index or through Manheim auctions for the Wholesale Index), adjusted by the original Recommended Retail Price (RRP) when the vehicle was bought brand new, and volume weighted.
The base period is December 2019 with a value of 100 points. For example, an Index of 144.2 in May 2023 indicates that overall, the sold price has increased by 44.2% compared to December 2019.
Note that in calculating the index, the following vehicles are excluded:
- Brand new or heavy commercial vehicles;
- Vehicles that have travelled more than 60,000 km per year;
- Vehicles with more than 300,000 km;
- Vehicles less than two years old or more than 10 years old (for the Manheim Wholesale Used Car Price Index);
- Vehicles over 15 years old (for the Retail Dealer Used Car Price Index).
Active Listings
Level of dealer used and demo car stock in the reporting period. Active Listings represents a significant portion of used vehicle inventory advertised by Dealers nationally at the end of June 2023.
Sold Vehicles (Delisted)
Total Year-to-Date number of Dealers’ Used & Demo Vehicles delisted from advertisement in the reporting period which is assumed as sold.
Market Days Supply
Measuring the Supply & Demand dynamic by dividing the total number of Used Active Listings by the total number of vehicles sold within the last 45 days. 70 days MDS is the industry benchmark. MDS higher than 70 indicates over supply and vice versa.
Days to Sell
Dealers’ Demo & Used – Average Days to Sell measures the duration (in days) between when a vehicle was first advertised to when it was sold.