
Used car prices soften, but it still depends on age and stage
Used vehicle prices continue to come down from the record highs of mid-2022, but with degrees of variability based on factors like fuel type, vehicle age, and body type.
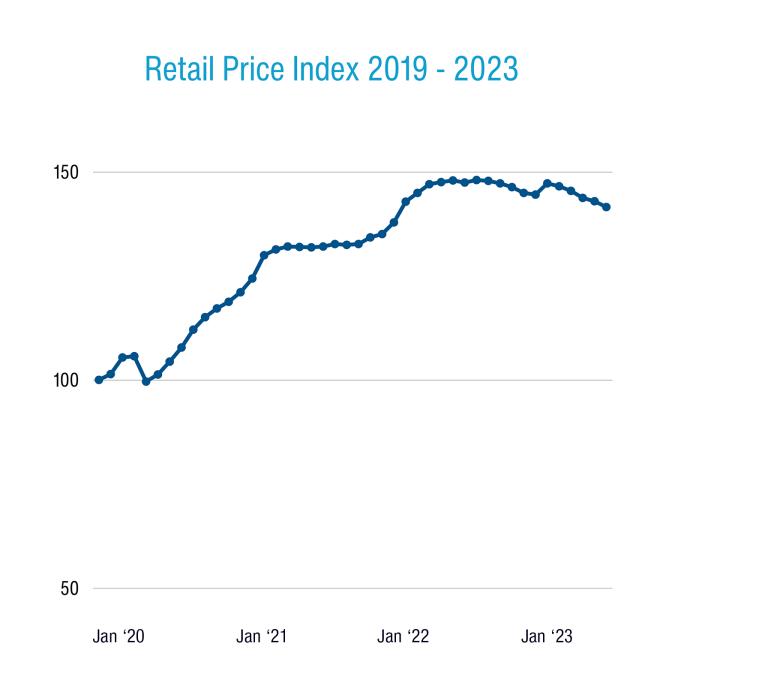
The Cox Automotive Australia National Retail – Dealer Used Car Prices Index, which measures price movements of sold dealer used vehicles over each month, ended July 2023 at 141.6.
That’s a modest 1.0% reduction month-over-month (MoM) and the fifth successive month where the (weighted average) index has fallen. It’s now 4.0% lower than the used market’s price peak in August last year.
But from a broader perspective, prices remain substantially higher than they were before the COVID-19 pandemic and associated market interruptions.
National Retail – Dealer Used Car Prices Index
The Price Index started at 100 in December 2019 and sits at 141.6 now, representing a 41.6% price increase on average over this period.
But context is key. The Price Index also shows us that, for the most part, the biggest proportionate price increases over the past few years have been on older used vehicles rather than newer, lower-mileage ones.
Used and demo passenger vehicles aged 2 years or younger ended July 29.3% more expensive on the Price Index than they were just before COVID. By contrast those aged 2-4 years remain 44.6% more expensive, those aged 5-7 years 53.2% more expensive, and those aged 8-10 years 69% more expensive.
There is a similar pattern across other vehicle types.
SUVs under 2 years of age finished July 20% higher on the Price Index than the same age bracket was in December 2019, compared to 32.6% higher for those aged 2-4 years, 35.9% for those aged 5-7 years, and 40.8% for those aged 8-10 years.
The Price Index for pickups under 2 years meanwhile finished July at 128.5, meaning a 28.5% average price increase over the same sorts of vehicles before COVID. By contrast pickups aged 2-4 years were on average 35.7% more expensive, pickups aged 5-7 were 44.7% more expensive, and those aged 8-10 were 56.3% pricier.
…From a broad perspective, used vehicle prices remain substantially higher than they were before COVID-19…
Across the board we see that it’s the older stock commanding much greater prices than they were before COVID. With improved supply of new vehicles filtering through, we’d expect to see reduced demand for late model used cars, so expect this trend to continue.
It’s a similar story for the used EV and PHEV market, which tends to be quite volatile given the smaller sample size of used models in dealer inventories. As we have been seeing for some time, the Price Indexes for these vehicles across age brackets are not holding up as well as combustion-engine vehicles and hybrids.
The respective Price Indexes for EVs and PHEVs are 99.4 (aged 2 or under), 115.4 (aged 2-4), 108 (aged 5-7), and 112 (aged 8-10). As you can see, the pattern where older vehicles are relatively more expensive than before COVID likewise applies to lower tailpipe emissions vehicles too, just at a lower level.
On that note, resale values of all second-hand electric vehicles and plug-in hybrids fell at a faster rate (3.1% MoM) than the overall car parc (1% MoM).
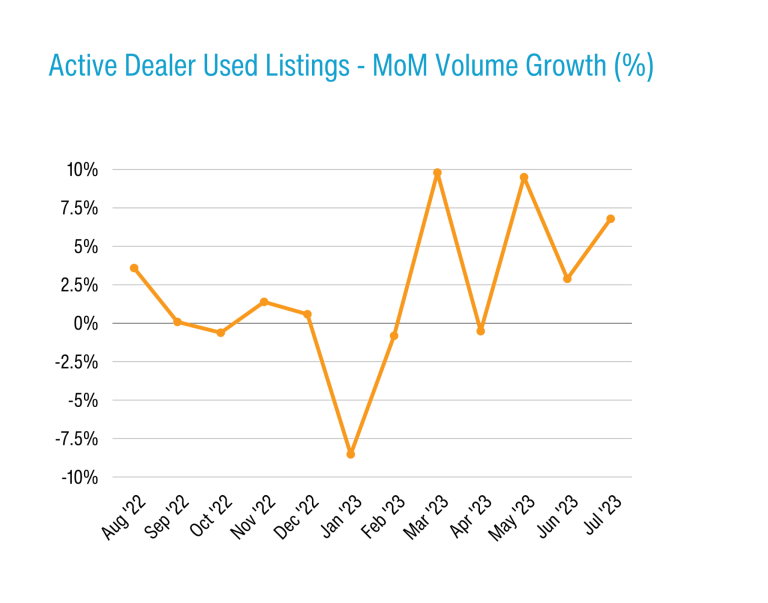
What else does the data show us? The overall number of active dealer used listings grew 6.8% MoM and 25.2% YoY for some longer-term context, meaning there are more used vehicles out there now. This drove an overall 3.8% MoM increase in Market Days Supply (MDS), which sits at 63 days across age brackets and vehicle types.
More used vehicle stock means downward price pressure should appear in market, however in the medium-term we should see the implications of a few years of new vehicle shortages: namely, a potential shortfall of late model used stock built between 2020 and 2022.
…With improved supply, we’d expect to see reduced demand for late model used cars…
Once again EVs and PHEVs are a statistical outlier with MDS figures of 76 days for those aged under 2 years, 77 days for those aged 2-4 years, and 87 days for those aged 5-7 years. Any number higher than 70 days means the market is carrying too much stock, but we will add the caveat that the sample size is still small.
The number of used vehicles sold was down 8.9% over a bumper June result. But year-to-date (YTD) the number of second-hand vehicles sold is still up 15.8% over 2022 at the same point in time. We’ve seen dealers moving stock faster, with the Average Days to Sell (41 days) metric down 1.1% MoM.
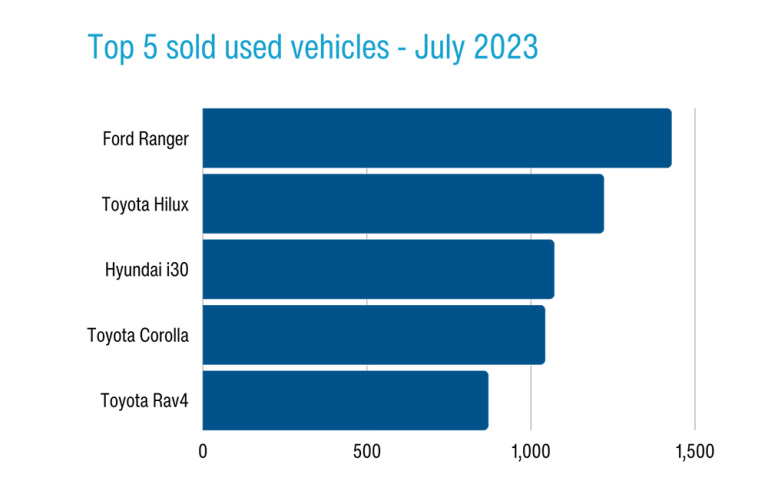
The top 5 selling passenger used nameplates across July were the Hyundai i30, Toyota Corolla, Mazda 3, Holden Commodore, and Kia Cerato. The top 5 SUVs were the Toyota RAV4, Nissan X-Trail, Mitsubishi Outlander, Mazda CX-5, and Toyota Prado.
Leading the used pickup sales race were the Ford Ranger and Toyota HiLux, which were also the two top-selling used vehicles of any type – the story is the same in the new market – ahead of the Mitsubishi Triton, Nissan Navara, and Holden Colorado.
…Resale values of all second hand electric vehicles and plug-in hybrids fell at a faster rate (-3.1 MoM) than the overall car parc (-1% MoM)…
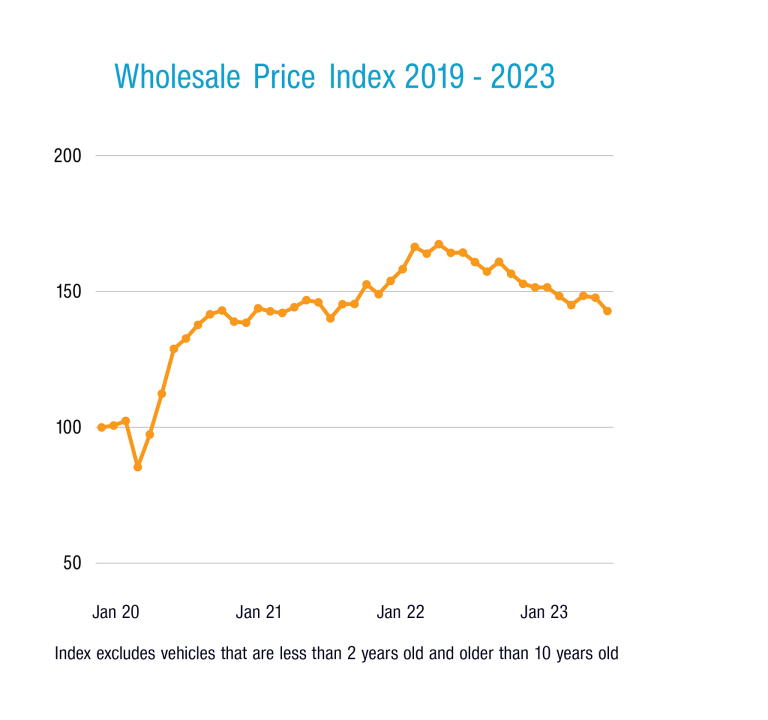
Manheim Wholesale – Used Car Prices Index
From a wholesale Manheim auction perspective, we’ve seen 19.5% YoY growth in volume driven in part by the return of in-person auctions at our sites across Australia.
Prices on average are reducing slowly, with the index (142.8) 3.3% down MoM and 13.1% down YoY. The index peaked in May 2022 at 167.4. The main client types were ex-fleet vehicles, dealer stock, and ex-OEM stock.
As we have seen in the retail used market, the prices of older wholesale stock remain more inflated in relative terms, as shown by the respective price indexes for vehicle types broken up by their age.
For instance, passenger vehicles aged 8-10 years sold in July were on average 84.5% more expensive in relative terms than pre-COVID, whereas those aged those aged 2-4 years were 35.7% more expensive.
Likewise for SUVs, those aged 5-7 years were 39.2% more expensive than the same sorts of vehicles were in December 2019, compared to 19.3% more expensive for those aged 2-4 years.
Older pickups aged 8 – 10 years were 141.4 on the Price Index at the end of July (meaning 41.4% more expensive than pre-COVID) compared to 19.4% more expensive for those aged 2-4.
The overall top 5 vehicles wholesaled through Manheim were the Ford Ranger, Toyota HiLux, Toyota Camry, Mitsubishi Triton, Holden Colorado.
Overall 33.2% of auctioned vehicles were SUVs, 30.8% were pickups, and 33% were passenger cars.
Read the latest full Market Insights Report Jan-Jun 2023 here
Definitions
Used Car Price Index
The Price Index tracks the movement of transaction prices relative to December 2019. It was created by taking the sold price of the used vehicles (from Dealers for the Retail Index or through Manheim auctions for the Wholesale Index), adjusted by the original Recommended Retail Price (RRP) when the vehicle was bought brand new, and volume weighted.
The base period is December 2019 with a value of 100 points. For example, an Index of 144.2 in May 2023 indicates that overall, the sold price has increased by 44.2% compared to December 2019.
Note that in calculating the index, the following vehicles are excluded:
- Brand new or heavy commercial vehicles;
- Vehicles that have travelled more than 60,000 km per year;
- Vehicles with more than 300,000 km;
- Vehicles less than two years old or more than 10 years old (for the Manheim Wholesale Used Car Price Index);
- Vehicles over 15 years old (for the Retail Dealer Used Car Price Index).
Active Listings
Level of dealer used and demo car stock in the reporting period. Active Listings represents a significant portion of used vehicle inventory advertised by Dealers nationally at the end of June 2023.
Sold Vehicles (Delisted)
Total Year-to-Date number of Dealers’ Used & Demo Vehicles delisted from advertisement in the reporting period which is assumed as sold.
Market Days Supply
Measuring the Supply & Demand dynamic by dividing the total number of Used Active Listings by the total number of vehicles sold within the last 45 days. 70 days MDS is the industry benchmark. MDS higher than 70 indicates over supply and vice versa.
Days to Sell
Dealers’ Demo & Used – Average Days to Sell measures the duration (in days) between when a vehicle was first advertised to when it was sold.