
Used car prices down as supply improves, while auction volumes hit three-year high
- Average dealer used vehicle prices have declined for nine straight months
- Dealer used and demonstrator inventory levels are at their healthiest since March 2020
- Manheim auction sales volume hits three year high, though prices are softening from record levels
- Economic hardships sees older used vehicles retain higher relative pricing than newer ones
Retail used price movements
Average used vehicle prices in Australia’s dealerships are currently the lowest they have been in almost two years, while availability as measured by stock levels continues to improve at a rapid pace.
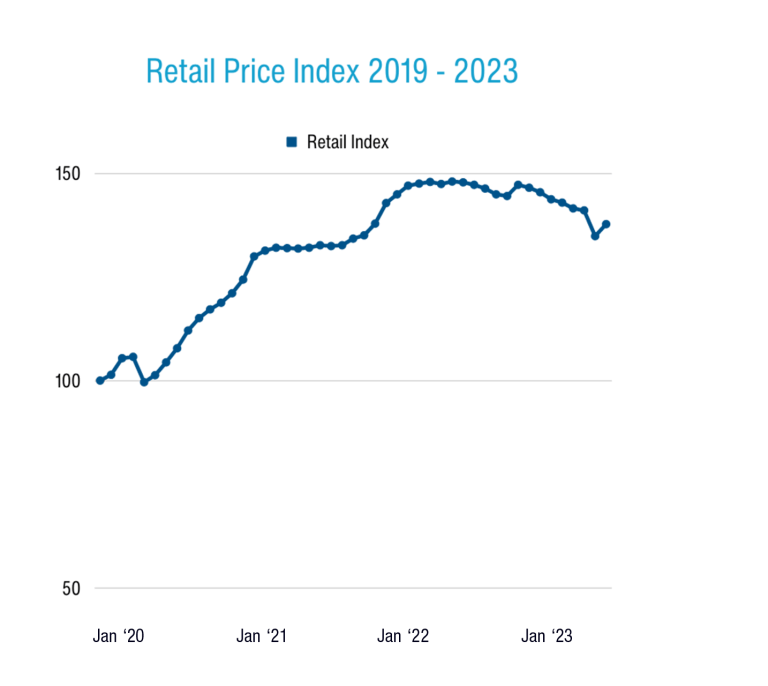
The Cox Automotive Australia (CAA) dealer delisted price index was 137.8 at the end of October, marking the ninth successive month of decline. The figure is now 7.0% lower than when average used and demonstrator vehicle prices in Australia’s dealers peaked in August 2022.
The CAA used vehicle price index, adjusted by MSRP and volume weighted, uses a 100-point base period of December 2019. The current index of 137.8 means, on average, a used vehicle is 37.8% more expensive than in December 2019, just before the COVID pandemic saw used prices spike on the back of new vehicle shortages.
While price indexes are generally falling this year irrespective of vehicle age and type, older cars continue to retain higher average price indexes than newer ones do. The pattern is consistent, suggesting the best value in relative terms is to be found on newer and typically more expensive inventory.
SUVs aged under 2 years have a price index of 116.3, whereas SUVs aged 8-10 years have an index of 139.4; pickups under 2 years have an index of 123.5 against 153.3 for those aged 8-10; and passenger cars under 2 years have a price index of 121.9 against 166.9 for those aged 8-10 years.
Across all vehicle age brackets in the CAA database, the overall price index for traditional lower-riding passenger cars is 147.6, which is notably higher than the price index for SUVs (130.7) and pickups (139).
This fact is interesting considering the ongoing decline in sales of these sorts of vehicles in the new car market, as OEMs roll out ever more SUVs and offer fewer new hatchbacks, sedans and wagons. It suggests customer demand for these vehicles might still be higher than what OEMs are providing the market with.
Retail used sales and stock
As expected, the ongoing reduction in average used vehicle prices correlates with continuous growth in levels of second-hand inventory in dealers – doubtless due in part to five of the past six months yielding all-time delivery records for new vehicles, resulting in a wave of trade-ins.
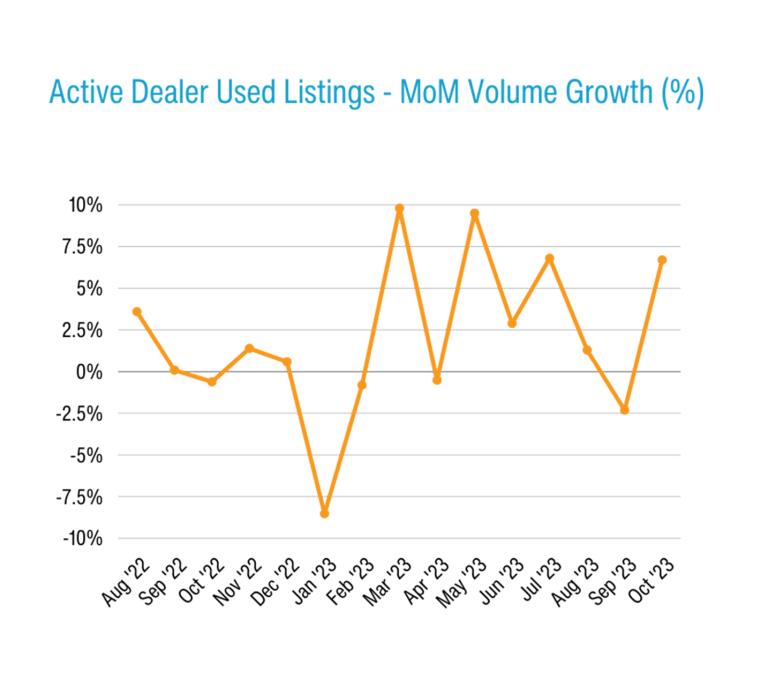
Available used and demonstrator stock in dealers is now at the highest level it has been since March of 2020, and up 37.5% since January this year. Inventory levels also grew 6.7% month-on-month in October and sit 28.3% higher than during the correlating month in 2022.
Dealer used vehicle sales, on the other hand, were up a more modest 15.4% over October 2022, and actually declined 4.3% month-on-month. This emerging divide between availability and interest has pushed overall market days supply of dealer used inventory to 65 days, the highest it’s been across the past 12 months.
Dealers on average are currently taking 41 days to re-sell a used vehicle. Some 39.4% of these sales required a price change before being delisted, by an average discount amount of 7.1% between listing and sale.
EV update
Battery electric vehicles (BEVs) and plug-in hybrid vehicles (PHEVs) make up only 0.3% of used vehicle sales and 0.5% of inventory at present – no shock given these vehicles really only started to spike in sales on the new side of things last year, and are therefore largely still with their first owners.
While the sample size is low, we’re seeing the used price index for BEVs and PHEVs (116.3) staying lower than other vehicle types, as issues such as customer doubts around used battery health, and factors discouraging used BEV demand such as new-car-focused fringe-benefits tax exemptions and state rebates playing their part.
On the plus side, we are also seeing signs of these volatile used BEV and PHEV prices stabilising as the data set slowly grows, with the overall peaks and troughs in average price movements notably more straight and steady over the past quarter.
Wholesale used insights update
In regards to the wholesale market, Manheim wholesale auction volume doubled in October 2023 over 2022, and grew 20% month-on-month. That’s the best volume result in three years, and demonstrates the uptick in business, government and rental fleet activity across the new and (subsequently) second-hand markets.
The Manheim wholesale price index is 139.2, which is 13.5% lower than it was this time last year, and down 16.8% from its May 2022 peak, meaning vendors need to recognise that wholesale prices are not likely to be as high as they were last year.
As we’re seeing on the retail side, older Manheim auction vehicles tend to hold higher price indexes than younger models. For example, vans and buses 2-4 years old have a wholesale auction price index of 140.8, whereas those aged 8-10 years have an index of 233.3.
There appears to be a link between demand for older wholesale stock – which naturally drives up prices – and the wider economic headwinds such as interest rates and inflation that are causing households to tighten their belts and look for more affordable vehicles.
Read the latest full Market Insights Report Jul-Sep 2023 here
Definitions
Used Car Price Index
The Price Index tracks the movement of transaction prices relative to December 2019. It was created by taking the sold price of the used vehicles (from Dealers for the Retail Index or through Manheim auctions for the Wholesale Index), adjusted by the original Recommended Retail Price (RRP) when the vehicle was bought brand new, and volume weighted.
The base period is December 2019 with a value of 100 points. For example, an Index of 144.2 in May 2023 indicates that overall, the sold price has increased by 44.2% compared to December 2019.
Note that in calculating the index, the following vehicles are excluded:
- Brand new or heavy commercial vehicles;
- Vehicles that have travelled more than 60,000 km per year;
- Vehicles with more than 300,000 km;
- Vehicles less than two years old or more than 10 years old (for the Manheim Wholesale Used Car Price Index);
- Vehicles over 15 years old (for the Retail Dealer Used Car Price Index).
Active Listings
Level of dealer used and demo car stock in the reporting period. Active Listings represents a significant portion of used vehicle inventory advertised by Dealers nationally at the end of June 2023.
Sold Vehicles (Delisted)
Total Year-to-Date number of Dealers’ Used & Demo Vehicles delisted from advertisement in the reporting period which is assumed as sold.
Market Days Supply
Measuring the Supply & Demand dynamic by dividing the total number of Used Active Listings by the total number of vehicles sold within the last 45 days. 70 days MDS is the industry benchmark. MDS higher than 70 indicates over supply and vice versa.
Days to Sell
Dealers’ Demo & Used – Average Days to Sell measures the duration (in days) between when a vehicle was first advertised to when it was sold.