
January Used Car Market: Sales Up, Inventories Down and Prices Steady
- Dealer used sales in the Cox Automotive Australia database outpace the new market, increasing 14.7% in January.
- Dealer used inventory down 2.6% month-over-month, reducing Market Days Supply to 65.
- CAA Price Index sits at 134, down almost 10% from the mid-2022 peak but now stabilising.
- Used passenger cars and older stock retaining more elevated prices than SUVs and newer cars.
Retail supply and demand
Dealer retail used vehicle sales grew 14.7% in January 2024 year-over-year (YoY), achieving the best volume since June and outpacing the 5.8% growth seen in the still record-setting new car market.
At the same time national dealer inventory or stock of used cars in the Cox Automotive Australia database decreased for the second straight month, ending January 2.6% lower than at the end of December.
These inventories overall remain much healthier than they were over the COVID period however, up 33.9% over January 2023. This means consumers have substantially greater choice than they did this time last year.
What’s happening? As supply pipelines on the new vehicle side have opened, this has created more trade-ins and greater fleet turnover in the wholesale sector, thereby populating used vehicle dealer lots.
Automotive OEMs and their franchise dealers are also placing more emphasis on the second-hand market than they used to, with ‘genuine’ used vehicle programs now a common sight.
The increase in used vehicle sales and decrease in used vehicle inventory across the month naturally saw the Market Days Supply (MDS) of used cars dip from 68 days to 65 days, below CAA’s 70-day benchmark.
MDS is a key metric used to determine if there’s undersupply or oversupply in the market.
Retail pricing
In terms of pricing across the total dealer used market, 39.5% of used vehicles were discounted between the first advertisement and the sale, by an average of 7.0% per vehicle.
Pricing also showed some signs of stabilisation after 10 successive monthly declines, with the Cox Automotive Australia Price Index down just 0.1% month-over-month (MoM).
The CAA Price Index finished January at 134, down from 134.2 at the end of 2023. This means the average price of used vehicles (adjusted by list price and volume weighted) is 34% greater than when the Index began in late 2019.
While therefore elevated above pre-COVID levels, prices across the market are down almost 10% from their August 2022 peak of 148.1, at the height of the (diminishing) new vehicle shortages.
January also saw the continuation of a theme, namely a tendency for second-hand traditional passenger hatchbacks and sedans to be more elevated in their price index than other vehicle types, and a tendency for older vehicles to likewise remain more elevated than younger ones.
These respective observations can be attributed in part to emerging shortfalls of quality passenger cars in the used market due to their long-term decline in sales when new, and increased consumer demand for older vehicles that are usually cheaper overall due to household budget pressures.
To show this clearly, the CAA Price Index of all passenger vehicles (Toyota Corolla, Hyundai i30 etc.) is 144.3, compared to 126.6 for SUVs and 133.9 for utes. And regardless of vehicle type, the price indexes tend to stay higher for older age brackets, as the below table demonstrates.
Cox Automotive Australia Price Index by vehicle type and age
| Segment | All ages |
|---|---|
| Passenger | 144.3 |
| SUVs | 126.6 |
| Utes | 133.9 |
| Vans & buses | 132.6 |
| < 2 years | 2-4 years |
|---|---|
| 119.6 | 136.6 |
| 113.3 | 124.8 |
| 118.9 | 129.4 |
| 120.7 | 132.6 |
| 5-7 years | 8-10 years |
|---|---|
| 147.4 | 162.0 |
| 127.4 | 133.8 |
| 136.5 | 147.7 |
| 131.4 | 141.3 |
Top-selling used vehicles for January
- Ford Ranger: Up 18.3% (MoM)
- Toyota Corolla: Up 15.8%
- Toyota HiLux: Up 14%
- Hyundai i30: Up 20.7%
- Toyota RAV4: Up 12.1%
In terms of major movers, we saw an 80.1% increase in sales of used and demonstrator MG ZS models aged under 2 years; a 49% spike in Ford Ranger sales aged 2-4 years; a 31.7% jump in Holden Colorado sales aged 5-7; and a 42.6% increase in sales of Hyundai i30s aged 8-10 years.
The models with the most listings
- Ford Ranger: Up 1.6% (MoM)
- Toyota HiLux: Down 3.2%
- Toyota Corolla: Down 3.9%
- Toyota RAV4: Down 1.8%
- Mitsubishi Triton: Down 3.4%
On the topic of an emerging inventory squeeze, we saw a 37.7% monthly decline in stock of used Toyota Corollas aged under 2 years and a 9.3% drop in Corollas aged 5-7.
Manheim Wholesale Summary
Manheim Australia posted strong results across its passenger and light commercial vehicle (PCV) auctions in January, getting 2024 off to a positive start.
Nationwide wholesale auction sales volume increased 37.8% year-over-year and 43.2% month-over-month, with the number of sold vehicles the second highest in a month since 2020.
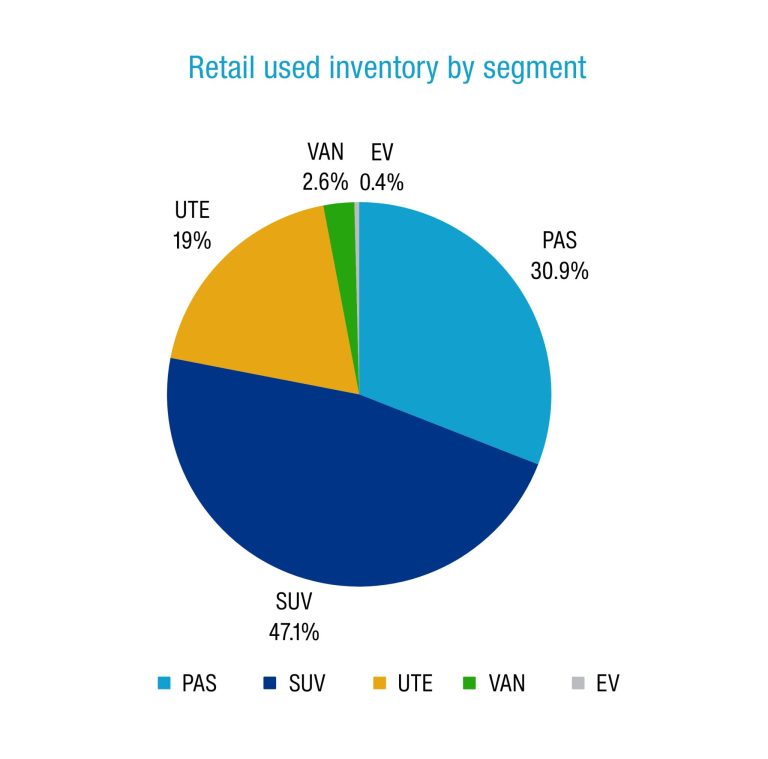
Manheim observed a relatively even mix of vehicle types coming through its auction lanes in January, 34.3% being SUVs, 31.7% traditional passenger vehicles, and 31.4% pickups. A further 2.5% were vans and buses, and just 0.2% were BEVs or PHEVs.
We do expect the share of battery-powered vehicles to grow in the coming years, with more than 120,000 new BEVs finding buyers since 2022, many to fleet buyers or on leases, with expected groundings to commence from next year.
Manheim is well positioned to handle this influx, with the company’s US operation remarketing more than 48,000 BEVs last year alone.
While prices fell across most of 2023, we have observed them hitting a plateau more recently, with the Manheim Price Index sitting between 138.1 and 140.5 for five successive months and finishing January 2024 at 138.7.
To put this into context, the Manheim Price Index peaked at 167.6 in May 2022, meaning expected wholesale prices across all segments and age brackets at 17.2% down from their most inflated.
In terms of where these auction vehicles were sourced from, the main suppliers are fleet companies, OEMs, Dealers, Government, Financiers, Corporates, and private sellers.
Read the latest full Market Insights Report Oct – Dec 2023 here
Definitions
Used Car Price Index
The Price Index tracks the movement of transaction prices relative to December 2019. It was created by taking the sold price of the used vehicles (from Dealers for the Retail Index or through Manheim auctions for the Wholesale Index), adjusted by the original Recommended Retail Price (RRP) when the vehicle was bought brand new, and volume weighted.
The base period is December 2019 with a value of 100 points. For example, an Index of 144.2 in May 2023 indicates that overall, the sold price has increased by 44.2% compared to December 2019.
Note that in calculating the index, the following vehicles are excluded:
- Brand new or heavy commercial vehicles;
- Vehicles that have travelled more than 60,000 km per year;
- Vehicles with more than 300,000 km;
- Vehicles less than two years old or more than 10 years old (for the Manheim Wholesale Used Car Price Index);
- Vehicles over 15 years old (for the Retail Dealer Used Car Price Index).
Active Listings
Level of dealer used and demo car stock in the reporting period. Active Listings represents a significant portion of used vehicle inventory advertised by Dealers nationally at the end of June 2023.
Sold Vehicles (Delisted)
Total Year-to-Date number of Dealers’ Used & Demo Vehicles delisted from advertisement in the reporting period which is assumed as sold.
Market Days Supply
Measuring the Supply & Demand dynamic by dividing the total number of Used Active Listings by the total number of vehicles sold within the last 45 days. 70 days MDS is the industry benchmark. MDS higher than 70 indicates over supply and vice versa.
Days to Sell
Dealers’ Demo & Used – Average Days to Sell measures the duration (in days) between when a vehicle was first advertised to when it was sold.