According to Cox Automotive Australia’s data, used vehicle sales by dealers grew 6.9% month on month (MoM) in August 2023 and 13.6% year on year (YoY), in parallel to the sharp growth we’re seeing in the new vehicle market.
Meanwhile, as improved supply has driven the new market to record sales in three of the past four months, so too has it correlated with an influx of second-hand stock arriving in dealers.
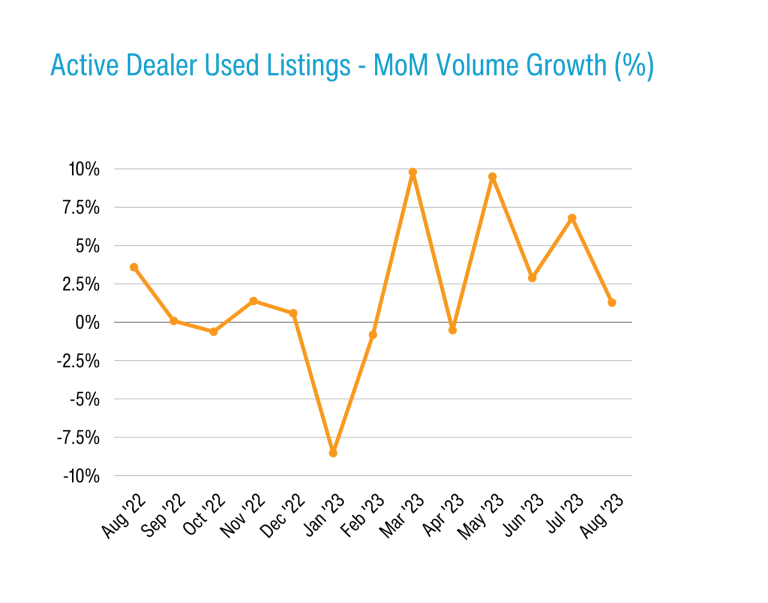
Active used and demo dealer listings grew 1.3% MoM in August but are currently 22.5% higher than at this point in 2022 and 31.9% higher than the start of 2023.
These factors are a key driver of ongoing price cooling across the used sector compared to the record highs of 2022 – albeit with significant differences across age brackets and vehicle types.
Retail used sales and stock
The number of used cars retailed by dealers in August was the second-highest figure since November 2021, the highest being in June this year.
The segment breakdown looks a little different than the new market, where SUVs own 56% market share, light commercials 22%, and conventional passenger vehicles just under 18%.
In August, fewer used and demo vehicle transactions were SUV body types (46.3%), with correspondingly more passenger vehicles (34.1%) than in the new car market. 19.4% of used and demo transactions were light commercials – more reflective of where the new market was a few years ago.
The top-selling used vehicles were the Ford Ranger (up 14.9% MoM), Toyota HiLux (up 18.9% MoM), Toyota Corolla (up 18.3% MoM), Hyundai i30 (up 11.7% MoM), and Toyota RAV4 (up 13.7% MoM).
As active dealer listings have grown (as mentioned, up 32% this year), you would expect market days’ supply to increase accordingly. However, this figure fell from 63 days to 62 days, based on ongoing demand. Our retail benchmark is 70 days for context.
…In August, fewer used and demo vehicles transactions were SUV body types (46.3%), with correspondingly more passenger vehicles (34.1%) than in the new car market. 19.4% of used and demo transactions were light commercials – more reflective of where the new market was a few years ago…
The top vehicles listed look very similar to the top-selling nameplates: In order the top five are the Ford Ranger, Toyota HiLux, Toyota Corolla, Toyota RAV4 and Hyundai i30.
There are some different models in this list as you break down listings by age bracket however, such as the MG HS (number four in the under 2 years age bracket), Mitsubishi Triton (number two in the 5-7 years bracket), and Holden Commodore (number 1 in the 8+ years group).
Retail used price movements
More than 40% (41.1%) of used vehicle retails had at least one price change between when they were first listed and when they were sold/delisted. The average price reduction was 7.1%.
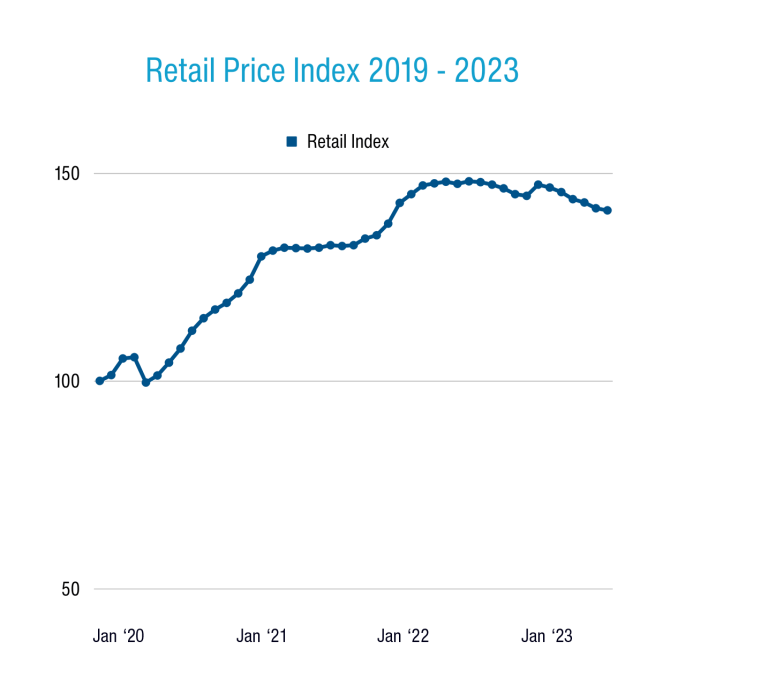
The Manheim Used Vehicle Price Index ended August 2023 at 141.1, down 0.4% MoM and 4.7% YoY. This means an average dealer used vehicle was about 4.7% cheaper today than at this point in 2022.
But an interesting pattern emerges when you dig down into the data a little further.
Dealer used and demo SUVs aged under 2 years sold for 19.9% more than just before COVID in December 2019, whereas those aged 2-4 were 31.1% more expensive, those aged 5-7 were 35.1% more expensive, and those aged 8-10 were 40.3% more expensive.
The pattern is similar for passenger vehicles (sedans, wagons and hatchbacks), which were on average 26.5% more expensive aged under 2 than the same sorts of vehicle were pre-COVID, 42.3% more expensive aged 2-4, 52.1% more expensive aged 5-7, and 69.7% more expensive aged 8-10.
As the market share of SUVs grows ever higher on the new vehicle side, the resultant shortfall of second-hand non-SUV passenger vehicles down the line creates a supply and demand imbalance which inflates prices.
On the LCV pickup side, those examples aged under 2 were an average of 25.5% more expensive than December 2019, those aged 2-4 were 34.8% more expensive, those aged 5-7 were 43.5% more expensive, and those aged 8-10 were 55.4% more expensive.
This pattern is consistent: ‘Newer’ used vehicles are, as a proportion of their price, far less inflated compared to 2019 than much older vehicles, which continue to hold onto their value very well – potentially a result of ongoing financial pressures forcing consumers to lower their budgets, increasing demand for cheaper cars.
Wholesale used insights
The Manheim wholesale business recorded volume growth in August as well, up 15.6% over July and 29.4% YoY, for its best result since March 2021.
The most-sold vehicles at our national auctions were the Ford Ranger (up 29% MoM), Holden Colorado (up 54.5% MoM), Mitsubishi Triton (up 15.6% MoM), Toyota Camry (up 8.7% MoM), and Hyundai i30 (up 23.1% MoM).
While there was an uptick in pricing for the month for passenger vehicles (up 4.1%) and SUVs (up 3.0%), both were down over where they were six months ago, by 0.6% and 5.1% respectively.
In terms of their price movements since pre-COVID (December 2019) across all age brackets, passenger vehicles ended August at 165.4 (65.4% more expensive on average over the December 2019 baseline), SUVs were 135.6, and LCV pickups were 137.3.
The overall Price Index sat at 146.0, or 46% higher than December 2019. This is down 9.2% YoY and down 12.7% from the May 2022 peak. So, while wholesale used vehicle prices remain high, they’re coming down too.
As we saw in the retail space, the price indexes for older wholesale used vehicles across sectors were greater on older stock than newer stock. In the most extreme case passenger vehicles aged 8-10 years ended August with a Price Index of 187.6, meaning they were nearly twice as expensive on average than in 2019.
Retailers operating in the used market face challenges. Beyond establishing the right customer-centric, omnichannel experience for buyers and sellers, they must maintain clear and concise stock profiles, implement ageing policies, and expand purchase channels and supply chains.
When it comes to this latter point, Manheim is perfectly placed to assist as the right procurement channel. The national vehicle wholesaler is again running in-person auctions across the eastern states of Australia, where buyers can kick the tyres, open the doors, and bid on vehicles in the metal as they drive past in our auction lanes.
The return to physical auctions naturally complements Manheim’s ongoing online simulcast auctions, which offer greater convenience by allowing buyers to bid from anywhere.
Electric vehicle insights
The sample size of second-hand EVs remains small, given uptake on the new side only spiked in 2022 and these vehicles are yet to trickle into the pre-owned market at scale. Just 0.2% of used vehicle transactions in dealers and 0.5% of listings are an EV or PHEV.
As we have seen in other regions, the resale value of used vehicles remains a concern due to a number of factors including buyer scepticism over battery health, government rebates and tax breaks pushing new vehicles only, and early adopter preference for the latest and greatest technology in a fast-iterating segment.
The overall price index for EVs and PHEVs ended August at 115.5, lower than the overall price indexes for other vehicle types. This price index for EVs and PHEVs has also come down 15% since February this year.
Moreover, the market days supply (45 day window) for EVs and PHEVs finished August at 70, greater than all other vehicle types including passenger cars (59), SUVs (65) and pickups (63).
New vehicle sales update
August new car sales totalled 109,966 units, up 15.4% YoY. This is the best August on record, following all-time record May and July results. YTD sales sit at 788,584, up 9.9% and the best tally since 2017.
Keep in mind the lingering effects of quarantine-related delays at ports such as Melbourne’s ro-ro Webb Dock, suggesting results could actually have been better.
The reality on the ground, though, is that forward orders and demand isn’t as robust as it seems. Rather, the numbers are in part down to delayed delivery of existing orders – private and fleet alike – as production normalises.
EVs grabbed 8.6% share of the passenger and SUV market, while hybrids including PHEVs took 15.6%.
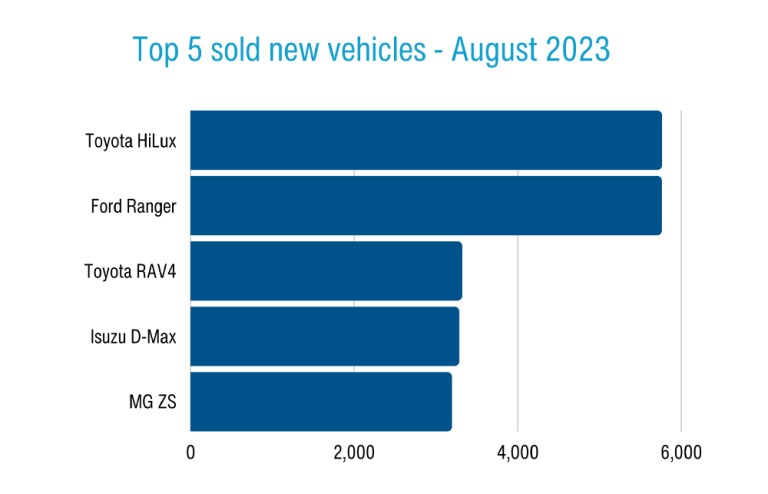
Toyota (22,231 sales) returned its market share to above 20% and had six models inside the overall top 20. The Toyota HiLux edged out the Ford Ranger by the barest of margins, but Ford won’t mind so much considering it dominated the more profitable 4×4 market.
Strong growth came from Ford (+35%), MG (+74%), Isuzu Ute (+68% for a new record haul), Subaru (+59%), Nissan (+154% including an all-time Patrol V8 record), and VW (+30%).
A great example of how OEMs are prioritising high-margin output is the fact the RAV4-based Lexus NX is setting records, with the brand already breaking its all-time annual sales record north of 10,000 units.
Read the latest full Market Insights Report Jan-Jun 2023 here
Definitions
Used Car Price Index
The Price Index tracks the movement of transaction prices relative to December 2019. It was created by taking the sold price of the used vehicles (from Dealers for the Retail Index or through Manheim auctions for the Wholesale Index), adjusted by the original Recommended Retail Price (RRP) when the vehicle was bought brand new, and volume weighted.
The base period is December 2019 with a value of 100 points. For example, an Index of 144.2 in May 2023 indicates that overall, the sold price has increased by 44.2% compared to December 2019.
Note that in calculating the index, the following vehicles are excluded:
- Brand new or heavy commercial vehicles;
- Vehicles that have travelled more than 60,000 km per year;
- Vehicles with more than 300,000 km;
- Vehicles less than two years old or more than 10 years old (for the Manheim Wholesale Used Car Price Index);
- Vehicles over 15 years old (for the Retail Dealer Used Car Price Index).
Active Listings
Level of dealer used and demo car stock in the reporting period. Active Listings represents a significant portion of used vehicle inventory advertised by Dealers nationally at the end of June 2023.
Sold Vehicles (Delisted)
Total Year-to-Date number of Dealers’ Used & Demo Vehicles delisted from advertisement in the reporting period which is assumed as sold.
Market Days Supply
Measuring the Supply & Demand dynamic by dividing the total number of Used Active Listings by the total number of vehicles sold within the last 45 days. 70 days MDS is the industry benchmark. MDS higher than 70 indicates over supply and vice versa.
Days to Sell
Dealers’ Demo & Used – Average Days to Sell measures the duration (in days) between when a vehicle was first advertised to when it was sold.